What are the main findings?
These figures come from US-reported CITES permit records and three peer-reviewed studies.
- The US reported importing 553,193 live specimens of stony coral for commercial purposes in 2024, and 80.2% were declared wild-collected (CITES Trade Database, US-reported).
- From 2014 to 2024 the US reported 6,368,711 live specimens of stony coral imported for commercial trade, and the wild-collected share stayed within a 74.9–92.9% band every year.
- The largest suppliers of live stony corals to the US in 2020–2024 were Indonesia 43.8%, Australia 42.7%, Tonga 5.0% of US-reported live specimens.
- US commercial imports of live seahorses fell to 1,747 live specimens in 2024, from 18,455 live specimens in 2014, and 94% of the 2024 seahorses were declared captive-bred or born in captivity.
- US imports of live giant clams were 34,240 live specimens in 2024, and 14.6% were declared wild.
- Commercial invoices for May 2004 to May 2005 recorded 11,003,181 fish of marine aquarium species imported into the US (Rhyne and colleagues, PLOS ONE, 2012).
- Of 734 marine fish species offered by four large US online retailers in 2021–2024, 89.2% of species were sold only as wild-caught (Lin and colleagues, Conservation Biology, 2026).
AquaCompat's guides cover freshwater fish, shrimp and snails; this page sets out the reef and marine side of the trade for comparison.
How many live corals does the US import, and how many are wild?
The US reported importing 553,193 live specimens of stony coral for commercial purposes in 2024, and about four in five carried the CITES source code W for wild-collected. Stony corals (order Scleractinia) are the hard, reef-building corals that reef keepers buy as colonies or fragments and are CITES-listed, so each shipment needs a permit and is recorded.
Volumes moved within a band rather than trending clearly, with the low year in 2019 and the high year in 2021, as the table shows. The wild share stayed within a 74.9–92.9% band in every year from 2014 to 2024. The captive-produced share mostly comes from code F (born in captivity) rather than code C (bred in captivity), and it dipped sharply in 2019 before recovering.
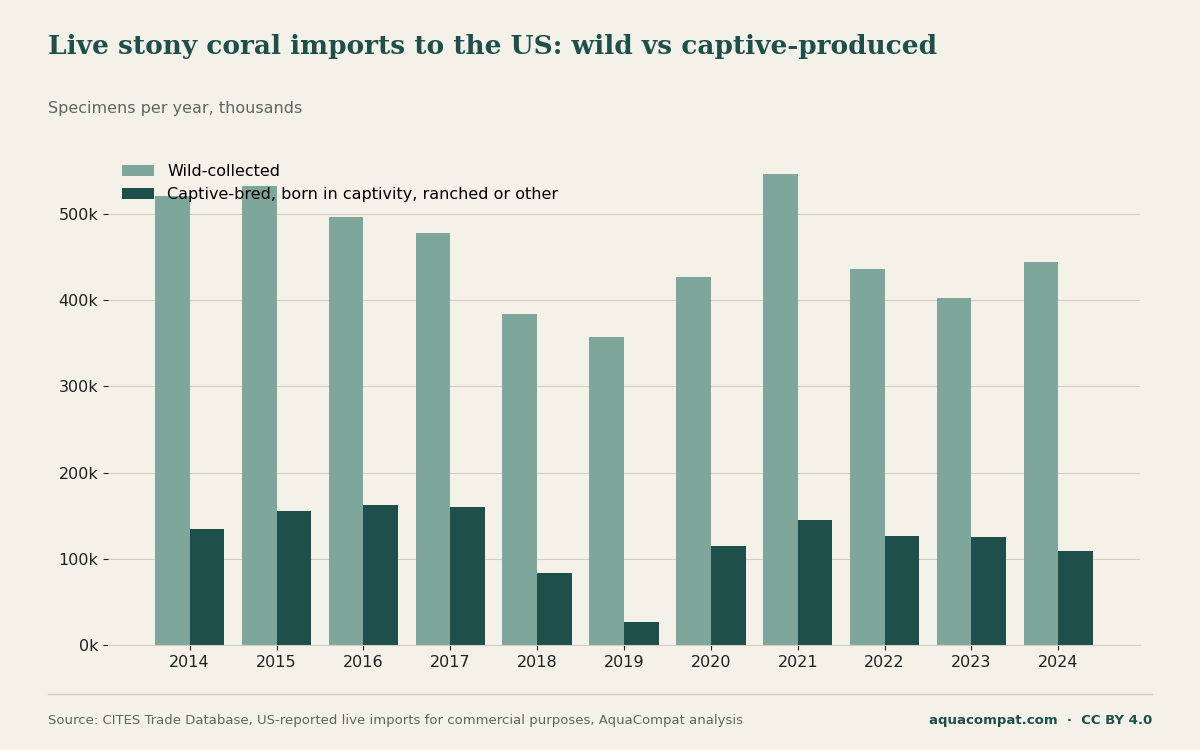
| year | total | wild_W | captive_bred_C | born_in_captivity_F | ranched_R | other | wild_share_pct |
|---|---|---|---|---|---|---|---|
| 2014 | 655,229 | 520,632 | 18,912 | 113,632 | 370 | 1,682 | 79.5 |
| 2015 | 688,148 | 532,425 | 19,681 | 134,202 | 200 | 1,640 | 77.4 |
| 2016 | 658,792 | 495,951 | 15,630 | 145,970 | 0 | 1,241 | 75.3 |
| 2017 | 638,380 | 477,858 | 9,320 | 149,962 | 0 | 1,240 | 74.9 |
| 2018 | 466,382 | 383,420 | 13,830 | 68,298 | 0 | 834 | 82.2 |
| 2019 | 384,855 | 357,626 | 17,948 | 7,849 | 0 | 1,432 | 92.9 |
| 2020 | 541,113 | 426,623 | 17,678 | 96,147 | 0 | 665 | 78.8 |
| 2021 | 691,776 | 546,843 | 22,779 | 120,843 | 0 | 1,311 | 79.0 |
| 2022 | 562,728 | 435,910 | 18,363 | 107,069 | 0 | 1,386 | 77.5 |
| 2023 | 528,115 | 402,878 | 15,647 | 107,744 | 487 | 1,359 | 76.3 |
| 2024 | 553,193 | 443,934 | 14,855 | 94,165 | 239 | 0 | 80.2 |
What about other CITES-listed corals?
Other CITES-listed corals, such as black corals, blue coral, fire corals and organ-pipe coral, are a small trade by comparison: a few thousand live specimens a year, nearly all declared wild, with the yearly count falling since 2014. Soft corals are not CITES-listed and do not appear in these counts.
| year | total | wild_W | captive_bred_C | born_in_captivity_F | ranched_R | other | wild_share_pct |
|---|---|---|---|---|---|---|---|
| 2014 | 6,158 | 6,040 | 19 | 55 | 0 | 44 | 98.1 |
| 2015 | 6,088 | 5,868 | 29 | 181 | 0 | 10 | 96.4 |
| 2016 | 4,842 | 4,781 | 0 | 61 | 0 | 0 | 98.7 |
| 2017 | 4,414 | 4,337 | 0 | 74 | 0 | 3 | 98.3 |
| 2018 | 3,464 | 3,346 | 0 | 55 | 0 | 63 | 96.6 |
| 2019 | 2,414 | 2,414 | 0 | 0 | 0 | 0 | 100.0 |
| 2020 | 3,888 | 3,034 | 839 | 10 | 0 | 5 | 78.0 |
| 2021 | 3,565 | 3,400 | 20 | 135 | 0 | 10 | 95.4 |
| 2022 | 2,520 | 2,447 | 10 | 58 | 0 | 5 | 97.1 |
| 2023 | 1,996 | 1,942 | 0 | 54 | 0 | 0 | 97.3 |
| 2024 | 2,253 | 2,157 | 4 | 92 | 0 | 0 | 95.7 |
Which countries supply the corals?
Indonesia and Australia supply almost all of them: the top three exporters of live stony corals to the US in 2020–2024 were Indonesia 43.8%, Australia 42.7%, Tonga 5.0% of US-reported live specimens. Over the full 2014–2024 period Indonesia's share was higher, so Australia's role has grown in recent years.
The exporter is the country that shipped the corals, so a re-exporter such as Hong Kong can appear; the table describes trade routes, not where every coral grew.
| period | rank | exporter | specimens | share_pct |
|---|---|---|---|---|
| 2014-2024 | 1 | Indonesia | 3,154,154 | 49.5 |
| 2014-2024 | 2 | Australia | 2,219,603 | 34.9 |
| 2014-2024 | 3 | Tonga | 363,298 | 5.7 |
| 2014-2024 | 4 | Fiji | 247,618 | 3.9 |
| 2014-2024 | 5 | Marshall Islands | 125,947 | 2.0 |
| 2014-2024 | 6 | Micronesia (Federated States of) | 55,951 | 0.9 |
| 2014-2024 | 7 | Solomon Islands | 52,335 | 0.8 |
| 2014-2024 | 8 | Viet Nam | 40,991 | 0.6 |
| 2014-2024 | 9 | Hong Kong, SAR | 40,483 | 0.6 |
| 2014-2024 | 10 | Malaysia | 18,250 | 0.3 |
| 2020-2024 | 1 | Indonesia | 1,260,886 | 43.8 |
| 2020-2024 | 2 | Australia | 1,227,016 | 42.7 |
| 2020-2024 | 3 | Tonga | 143,145 | 5.0 |
| 2020-2024 | 4 | Marshall Islands | 61,971 | 2.2 |
| 2020-2024 | 5 | Micronesia (Federated States of) | 37,261 | 1.3 |
| 2020-2024 | 6 | Fiji | 31,137 | 1.1 |
| 2020-2024 | 7 | Hong Kong, SAR | 30,327 | 1.1 |
| 2020-2024 | 8 | Viet Nam | 27,429 | 1.0 |
| 2020-2024 | 9 | Solomon Islands | 21,339 | 0.7 |
| 2020-2024 | 10 | Malaysia | 10,742 | 0.4 |
What happened to US seahorse imports?
US commercial imports of live seahorses fell steeply in a decade, to 1,747 live specimens in 2024, a small fraction of the 2014 figure shown in the table. Most of the drop happened early: 2014 and 2015 included large shipments declared as born in captivity (code F), which disappear from the records after 2015. From 2016 onward, most imported seahorses carried code C, bred in captivity, and in 2024 only a small minority were declared wild.
The supplier list changed too. Viet Nam was the largest exporter over 2014–2024 as a whole but does not appear in the 2020–2024 top ten, when Taiwan supplied more than half of US live seahorse imports and Australia came second. The CITES records do not say why volumes fell.
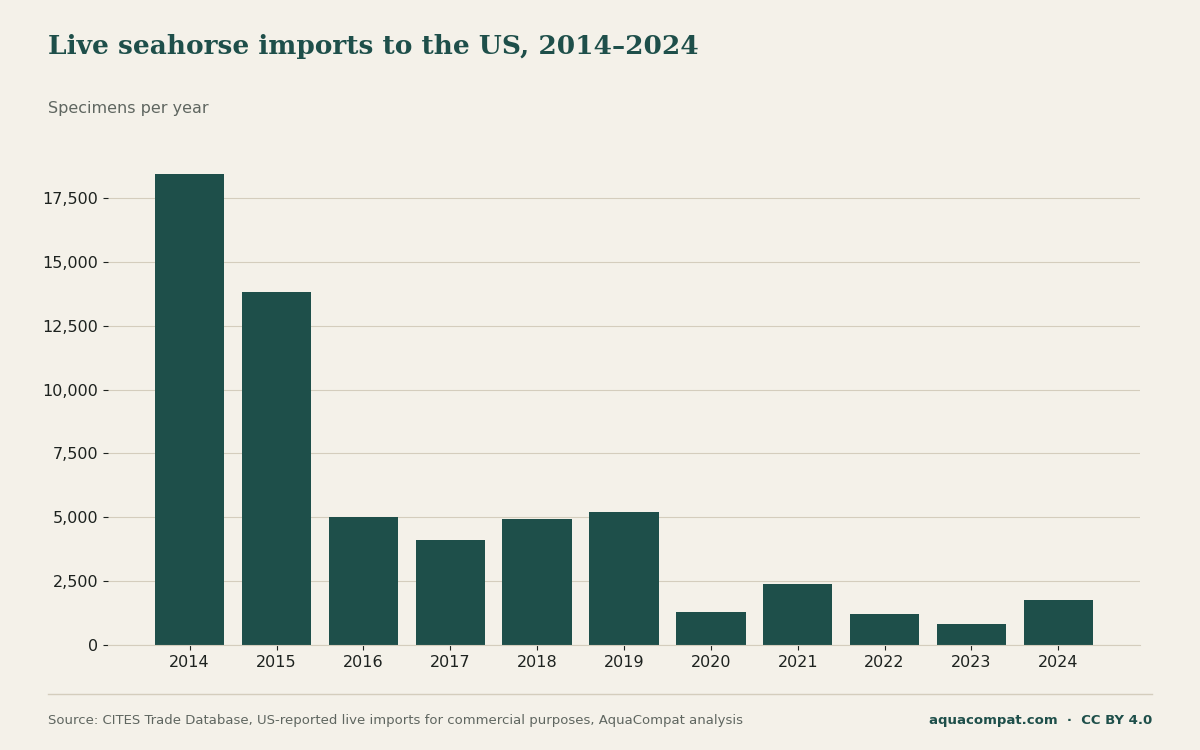
| year | total | wild_W | captive_bred_C | born_in_captivity_F | ranched_R | other | wild_share_pct |
|---|---|---|---|---|---|---|---|
| 2014 | 18,455 | 1,390 | 2,038 | 14,813 | 0 | 214 | 7.5 |
| 2015 | 13,802 | 1,979 | 2,431 | 9,247 | 0 | 145 | 14.3 |
| 2016 | 5,015 | 666 | 4,214 | 0 | 0 | 135 | 13.3 |
| 2017 | 4,127 | 1,192 | 2,795 | 120 | 0 | 20 | 28.9 |
| 2018 | 4,918 | 913 | 3,185 | 670 | 0 | 150 | 18.6 |
| 2019 | 5,188 | 809 | 3,772 | 147 | 0 | 460 | 15.6 |
| 2020 | 1,275 | 59 | 1,212 | 0 | 0 | 4 | 4.6 |
| 2021 | 2,393 | 303 | 2,086 | 0 | 0 | 4 | 12.7 |
| 2022 | 1,224 | 8 | 1,215 | 0 | 0 | 1 | 0.7 |
| 2023 | 835 | 104 | 731 | 0 | 0 | 0 | 12.5 |
| 2024 | 1,747 | 105 | 1,642 | 0 | 0 | 0 | 6.0 |
| period | rank | exporter | specimens | share_pct |
|---|---|---|---|---|
| 2014-2024 | 1 | Viet Nam | 25,875 | 43.9 |
| 2014-2024 | 2 | Taiwan, Province of China | 12,917 | 21.9 |
| 2014-2024 | 3 | Australia | 7,763 | 13.2 |
| 2014-2024 | 4 | Brazil | 3,825 | 6.5 |
| 2014-2024 | 5 | Sri Lanka | 2,718 | 4.6 |
| 2014-2024 | 6 | New Caledonia | 2,077 | 3.5 |
| 2014-2024 | 7 | Mexico | 1,658 | 2.8 |
| 2014-2024 | 8 | Indonesia | 1,118 | 1.9 |
| 2014-2024 | 9 | Denmark | 300 | 0.5 |
| 2014-2024 | 10 | Netherlands | 300 | 0.5 |
| 2020-2024 | 1 | Taiwan, Province of China | 4,136 | 55.3 |
| 2020-2024 | 2 | Australia | 1,207 | 16.1 |
| 2020-2024 | 3 | New Caledonia | 670 | 9.0 |
| 2020-2024 | 4 | Brazil | 618 | 8.3 |
| 2020-2024 | 5 | Netherlands | 300 | 4.0 |
| 2020-2024 | 6 | Mexico | 202 | 2.7 |
| 2020-2024 | 7 | China | 200 | 2.7 |
| 2020-2024 | 8 | Indonesia | 69 | 0.9 |
| 2020-2024 | 9 | Colombia | 36 | 0.5 |
| 2020-2024 | 10 | Switzerland | 15 | 0.2 |
Are giant clams in the trade wild or farmed?
Most giant clams imported into the US are now declared captive-produced: of 34,240 live specimens in 2024, fewer than one in six carried the wild code W, and the rest were declared bred in captivity (C) or born in captivity (F). The bar list shows how the wild share has fallen since 2014. Giant clams (family Tridacnidae) are CITES-listed bivalves kept in reef tanks.
Pacific island states dominate the supply. The three largest exporters of live giant clams to the US in 2020–2024 were Micronesia (Federated States of) 30.9%, French Polynesia 23.3%, Marshall Islands 18.7% of US-reported live specimens. Total volume was lower in 2024 than in any other year of the series.
- 201440.8
- 201520.9
- 201633.4
- 201724.5
- 201821.2
- 201936.3
- 202036.9
- 202136.3
- 202220.4
- 202320.4
- 202414.6
AquaCompat calculation: W specimens divided by total live commercial specimens, US-reported. Full counts by source code are in the table below and the CSV.
| year | total | wild_W | captive_bred_C | born_in_captivity_F | ranched_R | other | wild_share_pct |
|---|---|---|---|---|---|---|---|
| 2014 | 53,436 | 21,795 | 13,919 | 17,219 | 0 | 503 | 40.8 |
| 2015 | 63,775 | 13,315 | 27,557 | 22,342 | 0 | 561 | 20.9 |
| 2016 | 43,819 | 14,631 | 12,964 | 16,224 | 0 | 0 | 33.4 |
| 2017 | 44,404 | 10,891 | 15,138 | 18,375 | 0 | 0 | 24.5 |
| 2018 | 54,777 | 11,605 | 20,306 | 22,694 | 0 | 172 | 21.2 |
| 2019 | 43,502 | 15,803 | 14,384 | 12,767 | 0 | 548 | 36.3 |
| 2020 | 42,232 | 15,580 | 11,459 | 15,083 | 0 | 110 | 36.9 |
| 2021 | 39,768 | 14,424 | 10,090 | 15,243 | 0 | 11 | 36.3 |
| 2022 | 43,213 | 8,835 | 11,342 | 23,036 | 0 | 0 | 20.4 |
| 2023 | 43,446 | 8,864 | 18,465 | 16,069 | 0 | 48 | 20.4 |
| 2024 | 34,240 | 4,984 | 16,206 | 13,050 | 0 | 0 | 14.6 |
| period | rank | exporter | specimens | share_pct |
|---|---|---|---|---|
| 2014-2024 | 1 | French Polynesia | 126,367 | 24.9 |
| 2014-2024 | 2 | Micronesia (Federated States of) | 123,364 | 24.4 |
| 2014-2024 | 3 | Marshall Islands | 114,189 | 22.5 |
| 2014-2024 | 4 | Palau | 43,135 | 8.5 |
| 2014-2024 | 5 | Australia | 26,108 | 5.2 |
| 2014-2024 | 6 | Tonga | 22,573 | 4.5 |
| 2014-2024 | 7 | Indonesia | 16,554 | 3.3 |
| 2014-2024 | 8 | Egypt | 9,340 | 1.8 |
| 2014-2024 | 9 | Japan | 7,068 | 1.4 |
| 2014-2024 | 10 | Viet Nam | 6,137 | 1.2 |
| 2020-2024 | 1 | Micronesia (Federated States of) | 62,694 | 30.9 |
| 2020-2024 | 2 | French Polynesia | 47,336 | 23.3 |
| 2020-2024 | 3 | Marshall Islands | 37,928 | 18.7 |
| 2020-2024 | 4 | Palau | 14,227 | 7.0 |
| 2020-2024 | 5 | Egypt | 9,340 | 4.6 |
| 2020-2024 | 6 | Japan | 7,068 | 3.5 |
| 2020-2024 | 7 | Indonesia | 6,383 | 3.1 |
| 2020-2024 | 8 | Tonga | 5,871 | 2.9 |
| 2020-2024 | 9 | Viet Nam | 5,587 | 2.8 |
| 2020-2024 | 10 | Thailand | 3,118 | 1.5 |
How many marine aquarium fish come into the US, and how many are wild-caught?
Invoice studies count several million marine aquarium fish a year: 11,003,181 fish arrived between May 2004 and May 2005, and later counts were 8,299,467 (2008); 7,102,246 (2009); 6,892,960 (2011) fish. Most marine aquarium fish are not CITES-listed, so these counts come from researchers led by Andrew Rhyne reading importers' commercial invoices.
The 2012 PLOS ONE study found more than 1,802 species in the 2004–2005 imports, but the trade was concentrated: just 20 species made up 52% of the fish, led by two damselfishes, the blue-green chromis (Chromis viridis) and the sapphire devil (Chrysiptera cyanea). The main sources were Philippines 5.8 million; Indonesia 3.3 million fish. The 2017 PeerJ follow-up also counted 4.2, 3.7 and 3.6 million individuals non-CITES marine invertebrates in the same three years.
No verified source gives a current share of individual marine fish that are wild-caught. The closest measure is by species: a 2026 Conservation Biology study by Lin and colleagues checked four large US online retailers in 2021–2024 and found that, of 734 marine fish species offered, 89.2% of species were sold only as wild-caught. That is a share of species on sale, not of fish sold, since a few captive-bred species may sell in large numbers.
| year | fish | species |
|---|---|---|
| 2004-2005 | 11,003,181 | over 1,802 |
| 2008 | 8,299,467 | 1,788 |
| 2009 | 7,102,246 | 1,780 |
| 2011 | 6,892,960 | 1,798 |
How does marine fish trade value compare with freshwater?
US imports of live marine ornamental fish were worth 11.9 million USD in 2025, according to US data reported to UN Comtrade under customs code HS 030119, lower than in 2021. Freshwater ornamental fish imports were several times larger by value in the same year. The largest marine suppliers by value in 2025 were Indonesia 20.1%, Philippines 14.7%, Sri Lanka 9.2%, Fiji 6.1%, Kiribati 5.9% of US import value; Indonesia and the Philippines are the same two countries that led the invoice counts two decades earlier.
Freshwater stock, by contrast, is mostly farmed: a 2019 Journal of Fish Biology review estimates that about 90% of tropical freshwater fish in the ornamental trade are captive bred. Domestic output is on our US ornamental fish farm statistics page, and freshwater imports by partner country are in the ornamental fish import and export data.
| year | rank | partner | value_usd | share_pct |
|---|---|---|---|---|
| 2021 | 1 | Philippines | 3,727,268 | 22.2 |
| 2021 | 2 | Indonesia | 3,443,034 | 20.5 |
| 2021 | 3 | Sri Lanka | 1,874,968 | 11.2 |
| 2021 | 4 | Fiji | 1,386,769 | 8.3 |
| 2021 | 5 | Maldives | 518,658 | 3.1 |
| 2021 | 6 | Thailand | 495,494 | 3.0 |
| 2021 | 7 | Kenya | 490,196 | 2.9 |
| 2021 | 8 | Australia | 487,207 | 2.9 |
| 2021 | 9 | Singapore | 448,804 | 2.7 |
| 2021 | 10 | Other Asia, nes | 368,828 | 2.2 |
| 2022 | 1 | Philippines | 3,439,523 | 20.4 |
| 2022 | 2 | Indonesia | 3,260,714 | 19.3 |
| 2022 | 3 | Sri Lanka | 1,920,238 | 11.4 |
| 2022 | 4 | Fiji | 1,643,175 | 9.7 |
| 2022 | 5 | Other Asia, nes | 724,342 | 4.3 |
| 2022 | 6 | Maldives | 569,906 | 3.4 |
| 2022 | 7 | Thailand | 534,141 | 3.2 |
| 2022 | 8 | Singapore | 506,466 | 3.0 |
| 2022 | 9 | Kenya | 425,452 | 2.5 |
| 2022 | 10 | Australia | 387,696 | 2.3 |
| 2023 | 1 | Indonesia | 4,372,222 | 27.7 |
| 2023 | 2 | Philippines | 1,747,920 | 11.1 |
| 2023 | 3 | Sri Lanka | 1,485,608 | 9.4 |
| 2023 | 4 | Fiji | 1,120,842 | 7.1 |
| 2023 | 5 | Other Asia, nes | 935,040 | 5.9 |
| 2023 | 6 | Thailand | 811,889 | 5.1 |
| 2023 | 7 | French Polynesia | 589,599 | 3.7 |
| 2023 | 8 | Singapore | 549,297 | 3.5 |
| 2023 | 9 | Maldives | 535,910 | 3.4 |
| 2023 | 10 | Australia | 534,753 | 3.4 |
| 2024 | 1 | Indonesia | 4,256,695 | 28.4 |
| 2024 | 2 | Philippines | 1,525,139 | 10.2 |
| 2024 | 3 | Sri Lanka | 1,458,565 | 9.7 |
| 2024 | 4 | Fiji | 965,508 | 6.4 |
| 2024 | 5 | Other Asia, nes | 748,164 | 5.0 |
| 2024 | 6 | Singapore | 650,922 | 4.3 |
| 2024 | 7 | Thailand | 640,744 | 4.3 |
| 2024 | 8 | Kiribati | 586,872 | 3.9 |
| 2024 | 9 | Australia | 554,640 | 3.7 |
| 2024 | 10 | French Polynesia | 473,979 | 3.2 |
| 2025 | 1 | Indonesia | 2,396,918 | 20.1 |
| 2025 | 2 | Philippines | 1,754,746 | 14.7 |
| 2025 | 3 | Sri Lanka | 1,099,356 | 9.2 |
| 2025 | 4 | Fiji | 721,425 | 6.1 |
| 2025 | 5 | Kiribati | 703,709 | 5.9 |
| 2025 | 6 | Thailand | 700,806 | 5.9 |
| 2025 | 7 | Singapore | 621,786 | 5.2 |
| 2025 | 8 | Other Asia, nes | 573,561 | 4.8 |
| 2025 | 9 | Australia | 413,309 | 3.5 |
| 2025 | 10 | Maldives | 402,165 | 3.4 |
What do CITES source codes W, C, F and R mean?
A CITES source code is a single letter on each permit declaring where the animal came from. The four that matter for the aquarium trade are explained below.
- W, wild-collected: taken from the wild, such as a coral colony or seahorse collected on a reef.
- C, bred in captivity: produced by parents kept in a controlled environment that meet the CITES conditions for captive breeding.
- F, born in captivity: born or produced in a controlled environment but not meeting the full C conditions, for example offspring of wild-caught parents.
- R, ranched: collected from the wild as eggs or juveniles and then reared in captivity.
Other or missing codes are grouped under other. The codes are declarations, not independent checks. The 2017 PeerJ study by Rhyne and colleagues documents frequent mislabelling of wild and captive-bred animals in US import records. A one-year jump in the wild share, such as stony corals in 2019, may reflect how shipments were declared as much as where corals came from.
What does this mean for freshwater fishkeepers?
The main lesson carries over: origin labels are declarations, and the same questions apply to freshwater fish, where wild-caught cardinal tetras and farmed neons can sit side by side in a shop. Wild-caught fish of any kind travel further and pass through more holding systems, so a careful routine for bringing new fish home matters regardless of where they came from. Imported fish can also carry parasites, and the white-spot (ich) guide explains how quarantine helps.
Reef tanks run on salt mixed into purified water, a step shared with soft-water freshwater keeping, so our explainer on reverse osmosis and deionised water applies to both. For choosing freshwater species that live well together, the tank-mate compatibility checker covers the fish AquaCompat profiles.
How we built this data
The coral, giant clam and seahorse figures come from the CITES Trade Database comparative tabulation (CITES Secretariat and UNEP-WCMC), downloaded on 22 October 2026, database version 2026.1. We selected the United States as importer, term live, purpose T (commercial) and counted specimens, for Scleractinia, Antipatharia, Helioporidae, Milleporidae, Stylasteridae, Tubiporidae, Tridacnidae and Hippocampus. AquaCompat summed the US-reported quantities by year, source code and exporter, and calculated the wild share as W specimens divided by the total.
Marine fish counts are taken from the published tables of Rhyne and colleagues (PLOS ONE, 2012; PeerJ, 2017), the online retail figure from Lin and colleagues (Conservation Biology, 2026), and marine trade values from US-reported UN Comtrade data for HS 030119.
The totals are conservative, and the data have known gaps.
- Records reported only by the exporter are left out; over 2014–2024 they would add about 1.13 million live stony corals, 165,481 giant clams and 10,918 seahorses.
- Most marine aquarium fish, soft corals and invertebrates are not CITES-listed and are absent from the permit counts.
- Source codes are declared on permits, not verified per shipment.
- Coral traded by weight, and incomplete 2025 data, are excluded.
- For 2004–2005, government declarations and invoices gave about 15 million declared vs 11.0 million invoiced fish; Rhyne and colleagues found declaration errors, so the invoice count is used. For 2008 and 2009 the 2017 study's Table 1 values are used rather than its abstract.
Our wider approach is described in how AquaCompat sources and checks figures, and other datasets are listed in the AquaCompat data library.
How to cite this page
Use this citation, or link to this page next to the figure you use.
AquaCompat, "Coral, seahorse and marine aquarium fish trade: US import data (CITES, 2014–2024)", updated 22 October 2026, https://aquacompat.com/data/marine-aquarium-trade/. Underlying data: CITES Trade Database (CITES Secretariat and UNEP-WCMC); Rhyne et al. 2012 and 2017; Lin et al. 2026.
The data, tables and charts on this page are free to reuse under a Creative Commons Attribution 4.0 (CC BY 4.0) licence, provided you credit AquaCompat with a link to this page. Please also credit the CITES Trade Database as the original source of the permit figures.
Download the data
The CSV holds every US-reported yearly total used on this page for stony corals, other CITES corals, giant clams and seahorses, split by source code, with wild and captive shares. The charts are 1,200 by 750 pixel PNG images.
- US live imports of CITES corals, giant clams and seahorses, 2014–2024 (CSV) CSV · 8 KB
- Specimens by year and CITES source code, US-reported, commercial purpose.
- Chart: US live stony coral imports, wild vs captive PNG · 51 KB
- Specimens per year, 2014–2024.
- Chart: US live seahorse imports PNG · 42 KB
- Specimens per year, 2014–2024.
Questions people ask
Does AquaCompat cover saltwater fish or reef tanks?
Why are the US figures lower than some published coral trade totals?
Is a coral labelled captive-bred on a permit always farmed?
Why does the marine fish series stop in 2011?
Sources 17 documents from 12 publishers
- Animal Welfare (Cambridge University Press), Oldfield and Murphy, Case Western Reserve University (pmc.ncbi.nlm.nih.gov): “Life in a fishbowl: Space and environmental enrichment affect behaviour of Betta splendens”
- CITES Secretariat and UNEP-WCMC (trade.cites.org): “CITES Trade Database, comparative tabulation: importer United States, term live, taxa Scleractinia, Antipatharia, Helioporidae, Milleporidae, Stylasteridae, Tubiporidae, Tridacnidae, Hippocampus, 2014-2025 (database version 2026.1)”
- Conservation Biology, Lin, Zeng, To, Holmberg, Rhyne, Tlusty and Wilcove (doi.org): “Extent of threats to marine fish from the online aquarium trade in the United States”
- Journal of Fish Biology, Evers, Pinnegar and Taylor (Cefas and University of East Anglia) (ueaeprints.uea.ac.uk): “Where are they all from? – sources and sustainability in the ornamental freshwater fish trade”
- Molecular Biology and Evolution, Svardal et al. (pmc.ncbi.nlm.nih.gov): “Ancestral Hybridization Facilitated Species Diversification in the Lake Malawi Cichlid Fish Adaptive Radiation”
- Nature Communications, Meier et al. (pmc.ncbi.nlm.nih.gov): “Ancient hybridization fuels rapid cichlid fish adaptive radiations”
- PeerJ, Rhyne, Tlusty, Szczebak, Holmberg and Toonen (doi.org): “Expanding our understanding of the trade in marine aquarium animals”
- PLOS ONE, Rhyne, Tlusty, Schofield, Kaufman, Morris and Bruckner (New England Aquarium, USGS, NOAA and others) (doi.org): “Revealing the Appetite of the Marine Aquarium Fish Trade: The Volume and Biodiversity of Fish Imported into the United States”
- The Raffles Bulletin of Zoology, T. R. Roberts (lkcnhm.nus.edu.sg): “The "Celestial Pearl Danio", a new genus and species of colourful minute cyprinid fish from Myanmar (Pisces: Cypriniformes)”
- U.S. Geological Survey (nas.er.usgs.gov): “Carassius auratus (Goldfish) species profile, Nonindigenous Aquatic Species Database”; “Astronotus ocellatus (Oscar) species profile, Nonindigenous Aquatic Species Database”; “Pterygoplichthys disjunctivus (Vermiculated Sailfin Catfish) species profile, Nonindigenous Aquatic Species Database”; “Pomacea diffusa (spike-topped applesnail) species profile, Nonindigenous Aquatic Species Database”; “Neocaridina davidi (cherry shrimp) species profile, Nonindigenous Aquatic Species Database”; “Poecilia reticulata (Guppy) species profile, Nonindigenous Aquatic Species Database”
- United Nations Statistics Division, UN Comtrade (comtradeapi.un.org): “UN Comtrade public API, annual HS commodity data, codes 030111 and 030119 (reporter United States and all reporters, 2021-2025)”
- USDA National Agricultural Statistics Service (data.nass.usda.gov): “2023 Census of Aquaculture, Volume 3, Special Studies, Part 2 (AC-22-SS-2)”
All sources accessed , . Every number on this page comes from these documents.