What are the main findings?
Ornamental fish, in customs terms, are live fish traded for aquariums and ponds rather than for food. The figures below come from UN Comtrade customs records for 2021 to 2025, analysed by AquaCompat.
- The US imported 63.3 million USD of live freshwater ornamental fish in 2025, from 64 partner countries.
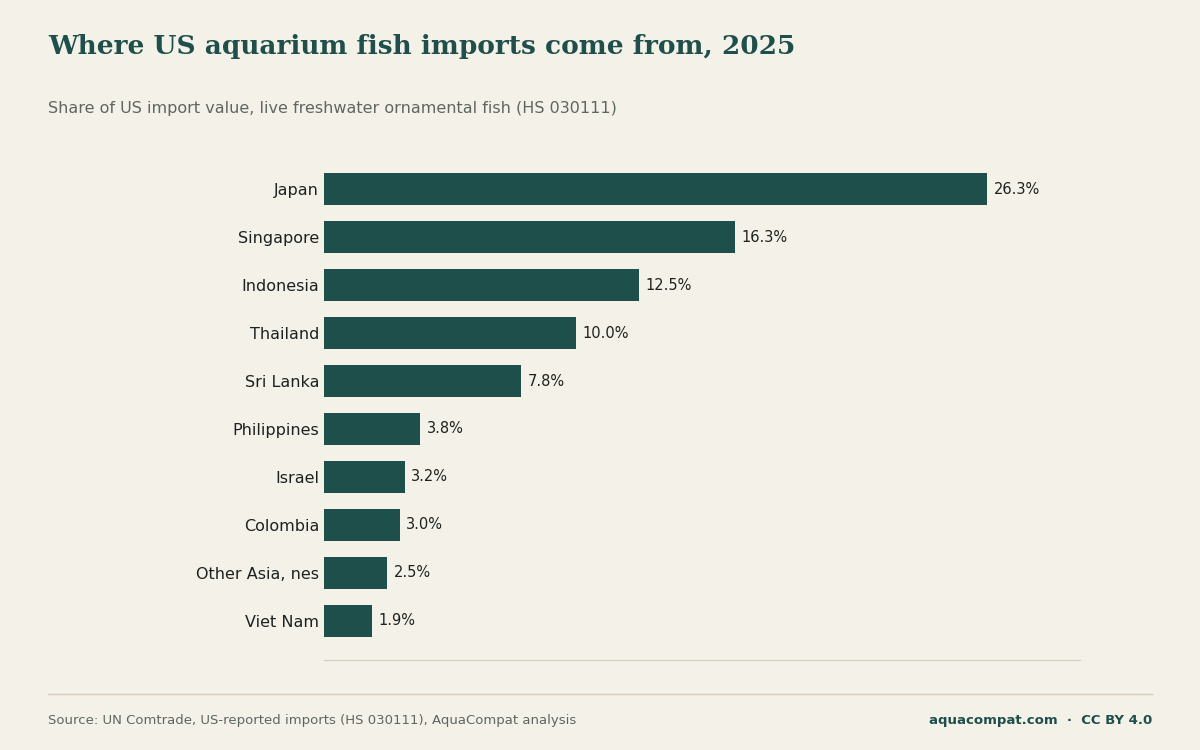
- Japan supplied the largest share of US freshwater ornamental fish imports by value in 2025; the top five suppliers were Japan 26.3%, Singapore 16.3%, Indonesia 12.5%, Thailand 10.0%, Sri Lanka 7.8% of US import value. Singapore had ranked first in every year from 2021 to 2024.
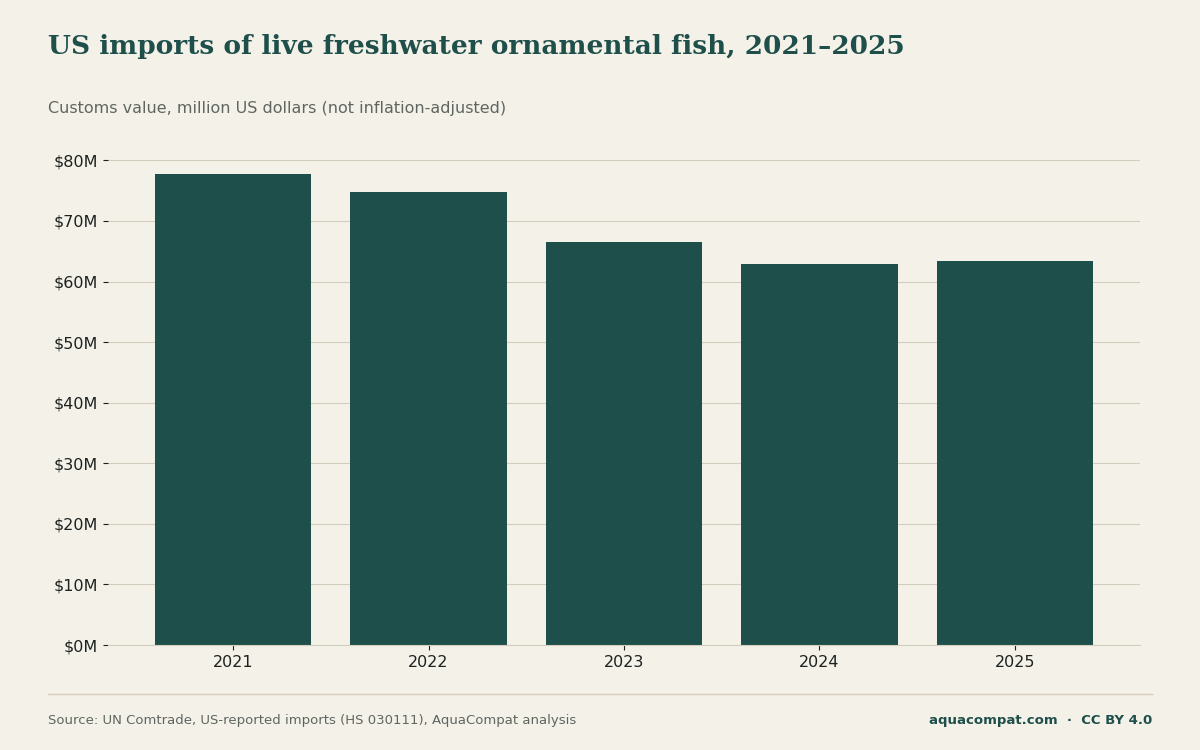
- US freshwater ornamental fish imports changed by -18.6% in value between 2021 (77.8 million USD) and 2025, in current dollars not adjusted for inflation.
- The US imported 11.9 million USD of live marine and other non-freshwater ornamental fish in 2025, a change of -29% on 2021; Indonesia and the Philippines were the two largest suppliers.
- Among the 115 reporting countries that sent 2024 data, the US was the largest importer of freshwater ornamental fish, with 25% of their combined 252 million USD in imports; China was second.
- Japan was the largest reporting exporter of freshwater ornamental fish in 2024, at 48.3 million USD or 19.2% of reported exports; Indonesia and Singapore followed.
- US exports of freshwater ornamental fish were 2.6 million USD in 2025, so US imports were about 24 times larger than exports by value.
- A 2019 Journal of Fish Biology review estimates that about 90% of global ornamental fish trade volume is tropical freshwater fish, and that about 90% of those are captive bred.
How much aquarium fish does the US import, and from where?
The US imported 63.3 million USD of live freshwater ornamental fish in 2025 from 64 partner countries, and five suppliers provided about 73% of that value, by AquaCompat's sum of their shares: Japan 26.3%, Singapore 16.3%, Indonesia 12.5%, Thailand 10.0%, Sri Lanka 7.8% of US import value.
The supplier list was stable until 2025. Singapore ranked first in every year from 2021 to 2024, and the same seven partners (Singapore, Thailand, Sri Lanka, Indonesia, Japan, the Philippines and Taiwan, labelled "Other Asia, nes" by Comtrade) held the top seven places in 2021, 2022 and 2023. The 2025 change came from Japan, whose sales to the US more than doubled in value from 2024 while most other leading suppliers sold less.
The Japanese figure needs a caution. Customs code HS 030111 covers all live freshwater ornamental fish, including koi and goldfish, and the Comtrade dataset notes that Japan's high values largely reflect koi, though this was not verified species by species. A rise in value says little about how many fish arrived.
| year | rank | partner | value_usd | share_pct |
|---|---|---|---|---|
| 2021 | 1 | Singapore | 14,593,098 | 18.8 |
| 2021 | 2 | Thailand | 11,947,073 | 15.4 |
| 2021 | 3 | Sri Lanka | 9,486,193 | 12.2 |
| 2021 | 4 | Indonesia | 7,526,591 | 9.7 |
| 2021 | 5 | Japan | 7,473,723 | 9.6 |
| 2021 | 6 | Philippines | 6,445,635 | 8.3 |
| 2021 | 7 | Other Asia, nes | 4,113,265 | 5.3 |
| 2021 | 8 | Viet Nam | 2,153,357 | 2.8 |
| 2021 | 9 | Colombia | 1,733,749 | 2.2 |
| 2021 | 10 | Kenya | 1,400,191 | 1.8 |
| 2022 | 1 | Singapore | 14,184,561 | 19.0 |
| 2022 | 2 | Thailand | 11,121,769 | 14.9 |
| 2022 | 3 | Sri Lanka | 9,203,797 | 12.3 |
| 2022 | 4 | Indonesia | 8,370,644 | 11.2 |
| 2022 | 5 | Japan | 7,642,014 | 10.2 |
| 2022 | 6 | Philippines | 5,869,666 | 7.8 |
| 2022 | 7 | Other Asia, nes | 3,606,811 | 4.8 |
| 2022 | 8 | Malaysia | 1,800,879 | 2.4 |
| 2022 | 9 | Colombia | 1,778,169 | 2.4 |
| 2022 | 10 | Israel | 1,326,106 | 1.8 |
| 2023 | 1 | Singapore | 12,291,606 | 18.5 |
| 2023 | 2 | Thailand | 8,588,521 | 12.9 |
| 2023 | 3 | Sri Lanka | 8,082,703 | 12.2 |
| 2023 | 4 | Indonesia | 7,900,251 | 11.9 |
| 2023 | 5 | Japan | 7,833,561 | 11.8 |
| 2023 | 6 | Philippines | 4,142,956 | 6.2 |
| 2023 | 7 | Other Asia, nes | 3,342,883 | 5.0 |
| 2023 | 8 | Colombia | 1,889,740 | 2.8 |
| 2023 | 9 | Viet Nam | 1,473,859 | 2.2 |
| 2023 | 10 | Israel | 1,097,189 | 1.7 |
| 2024 | 1 | Singapore | 11,435,610 | 18.2 |
| 2024 | 2 | Japan | 7,899,900 | 12.6 |
| 2024 | 3 | Thailand | 7,813,130 | 12.4 |
| 2024 | 4 | Indonesia | 7,785,761 | 12.4 |
| 2024 | 5 | Sri Lanka | 6,995,571 | 11.1 |
| 2024 | 6 | Other Asia, nes | 3,012,844 | 4.8 |
| 2024 | 7 | Philippines | 2,885,954 | 4.6 |
| 2024 | 8 | Viet Nam | 1,861,851 | 3.0 |
| 2024 | 9 | Colombia | 1,770,977 | 2.8 |
| 2024 | 10 | Israel | 1,608,874 | 2.6 |
| 2025 | 1 | Japan | 16,664,303 | 26.3 |
| 2025 | 2 | Singapore | 10,329,513 | 16.3 |
| 2025 | 3 | Indonesia | 7,892,889 | 12.5 |
| 2025 | 4 | Thailand | 6,315,767 | 10.0 |
| 2025 | 5 | Sri Lanka | 4,939,865 | 7.8 |
| 2025 | 6 | Philippines | 2,412,030 | 3.8 |
| 2025 | 7 | Israel | 2,043,511 | 3.2 |
| 2025 | 8 | Colombia | 1,930,594 | 3.0 |
| 2025 | 9 | Other Asia, nes | 1,579,619 | 2.5 |
| 2025 | 10 | Viet Nam | 1,227,496 | 1.9 |
Why do the supplier countries matter to fishkeepers?
Supplier countries matter because an imported fish has travelled from an exporter, usually in Asia, to a US importer, then to a wholesaler, a store and a home tank.
Long journeys mean stress. UF/IFAS Extension reports that death-on-arrival losses between exporter and importer have been reduced to less than 5%, citing Lim (2005), but that covers only the trip to the importer, not the weeks after a fish reaches a hobbyist. Careful acclimation of newly bought fish and a quarantine period help with this, and newly shipped fish are one route for white spot disease (ich) to enter a display tank.
Is the US aquarium fish trade growing or shrinking (2021–2025)?
The US import trade in freshwater ornamental fish shrank in value between 2021 and 2025, a change of -18.6%, from 77.8 million USD to 63.3 million USD in current dollars. Most of the fall came between 2021 and 2024; in 2025 the value was roughly flat, held up by the jump in imports from Japan.
Because the figures are not adjusted for inflation, the fall in real terms would be larger, not smaller. Reported net weight of US freshwater imports also fell in every year in the table below, which points to fewer or lighter shipments rather than a pure price effect. The series starts in 2021, so it cannot say whether that year was unusually high, and the customs data show what changed, not why.
| year | hs_code | flow | value_usd | net_weight_kg | partner_countries |
|---|---|---|---|---|---|
| 2021 | 030111 | Import | 77,820,718 | 4,328,093 | 54 |
| 2021 | 030111 | Export | 4,151,376 | 245,800 | 32 |
| 2021 | 030119 | Import | 16,791,333 | 1,033,968 | 42 |
| 2021 | 030119 | Export | 2,958,673 | 154,127 | 40 |
| 2022 | 030111 | Import | 74,825,813 | 3,686,152 | 52 |
| 2022 | 030111 | Export | 3,742,488 | 220,231 | 38 |
| 2022 | 030119 | Import | 16,882,833 | 996,718 | 41 |
| 2022 | 030119 | Export | 2,865,339 | 158,531 | 37 |
| 2023 | 030111 | Import | 66,445,072 | 3,497,632 | 49 |
| 2023 | 030111 | Export | 2,964,334 | 147,967 | 30 |
| 2023 | 030119 | Import | 15,806,999 | 997,010 | 43 |
| 2023 | 030119 | Export | 3,883,992 | 203,604 | 44 |
| 2024 | 030111 | Import | 62,924,145 | 3,311,909 | 58 |
| 2024 | 030111 | Export | 3,010,270 | 160,401 | 32 |
| 2024 | 030119 | Import | 15,003,970 | 978,614 | 46 |
| 2024 | 030119 | Export | 2,833,064 | 137,453 | 43 |
| 2025 | 030111 | Import | 63,314,944 | 3,153,216 | 64 |
| 2025 | 030111 | Export | 2,639,882 | 40,328 | 30 |
| 2025 | 030119 | Import | 11,917,830 | 775,708 | 41 |
| 2025 | 030119 | Export | 2,628,159 | 102,487 | 41 |
Does the US export aquarium fish?
The US exports aquarium fish, but on a small scale: 2.6 million USD of live freshwater ornamental fish in 2025, with Canada taking 34.6%. Imports were about 24 times larger by value. Domestic production is a separate story, told on our page of US ornamental fish farming statistics: US farms sold $77.1 million of fish in 2023, according to the USDA Census of Aquaculture. Farm-gate sales and customs values are measured differently, so the two totals should not be added or compared directly.
Which countries lead the world aquarium fish trade (2024)?
The United States led world imports of freshwater ornamental fish in 2024 and Japan led world exports, among countries that report to UN Comtrade. The US took 25% of the combined imports of 115 reporting countries, ahead of China, the United Kingdom, Japan and Germany. Japan reported 48.3 million USD of exports in 2024, or 19.2% of the reported total, ahead of Indonesia and Singapore, and 66.2 million USD in 2025.
Czechia (fifth) and France (seventh) were the largest European exporters in 2024. The Netherlands and the United Kingdom appear on both the import and export lists; the customs data cannot separate re-exports from fish bred locally. These are rankings of reporting countries only, and 2025 had fewer reporters than 2024, so its rows are less complete.
| year | rank | country | value_usd | share_of_reported_pct |
|---|---|---|---|---|
| 2024 | 1 | USA | 62,924,145 | 25.0 |
| 2024 | 2 | China | 27,835,679 | 11.0 |
| 2024 | 3 | United Kingdom | 19,229,603 | 7.6 |
| 2024 | 4 | Japan | 12,809,634 | 5.1 |
| 2024 | 5 | Germany | 12,239,812 | 4.9 |
| 2024 | 6 | Malaysia | 11,870,035 | 4.7 |
| 2024 | 7 | Singapore | 10,417,129 | 4.1 |
| 2024 | 8 | France | 9,728,358 | 3.9 |
| 2024 | 9 | Netherlands | 8,311,798 | 3.3 |
| 2024 | 10 | Italy | 6,840,995 | 2.7 |
| 2025 | 1 | USA | 63,314,944 | 24.6 |
| 2025 | 2 | China | 26,084,345 | 10.1 |
| 2025 | 3 | United Kingdom | 24,224,128 | 9.4 |
| 2025 | 4 | Germany | 15,948,335 | 6.2 |
| 2025 | 5 | Japan | 12,912,448 | 5.0 |
| 2025 | 6 | Singapore | 11,330,316 | 4.4 |
| 2025 | 7 | Netherlands | 9,011,504 | 3.5 |
| 2025 | 8 | France | 8,918,750 | 3.5 |
| 2025 | 9 | Malaysia | 6,793,616 | 2.6 |
| 2025 | 10 | Canada | 5,910,621 | 2.3 |
| year | rank | country | value_usd | share_of_reported_pct |
|---|---|---|---|---|
| 2024 | 1 | Japan | 48,278,881 | 19.2 |
| 2024 | 2 | Indonesia | 33,223,015 | 13.2 |
| 2024 | 3 | Singapore | 32,798,427 | 13.0 |
| 2024 | 4 | Thailand | 19,670,184 | 7.8 |
| 2024 | 5 | Czechia | 18,082,264 | 7.2 |
| 2024 | 6 | Sri Lanka | 16,860,332 | 6.7 |
| 2024 | 7 | France | 15,934,576 | 6.3 |
| 2024 | 8 | Malaysia | 14,247,064 | 5.7 |
| 2024 | 9 | United Kingdom | 8,907,527 | 3.5 |
| 2024 | 10 | Netherlands | 8,291,104 | 3.3 |
| 2025 | 1 | Japan | 66,225,695 | 25.4 |
| 2025 | 2 | Indonesia | 34,187,916 | 13.1 |
| 2025 | 3 | Singapore | 32,139,426 | 12.3 |
| 2025 | 4 | Czechia | 21,705,022 | 8.3 |
| 2025 | 5 | Thailand | 20,267,282 | 7.8 |
| 2025 | 6 | Sri Lanka | 15,988,331 | 6.1 |
| 2025 | 7 | France | 13,389,998 | 5.1 |
| 2025 | 8 | Malaysia | 12,550,507 | 4.8 |
| 2025 | 9 | Netherlands | 8,873,099 | 3.4 |
| 2025 | 10 | Colombia | 7,606,868 | 2.9 |
How much of the aquarium fish trade is freshwater and how much is marine?
Freshwater fish make up most of the aquarium fish trade: a 2019 Journal of Fish Biology review by Cefas and University of East Anglia scientists estimates that 90% of global ornamental fish trade volume is tropical freshwater fish, citing Raghavan and colleagues (2013). US customs values point the same way: freshwater fish were about 84% of combined 2025 import value, by AquaCompat's calculation from 63.3 million USD freshwater and 11.9 million USD other ornamental fish.
The non-freshwater code, HS 030119, is mostly marine fish. Its largest US suppliers in 2025 were Indonesia 20.1%, Philippines 14.7%, Sri Lanka 9.2%, Fiji 6.1%, Kiribati 5.9% of US import value. The same review counts more than 5,300 freshwater and 1,802 marine species in trade, so marine fish are a small share of volume but a large share of species. AquaCompat covers freshwater fish; the page on marine aquarium trade data covers reef fish, corals and seahorses. In the world marine tables below, Spain ranks high on both lists, and the Comtrade dataset flags that some of its values may include non-aquarium trade.
| year | rank | partner | value_usd | share_pct |
|---|---|---|---|---|
| 2021 | 1 | Philippines | 3,727,268 | 22.2 |
| 2021 | 2 | Indonesia | 3,443,034 | 20.5 |
| 2021 | 3 | Sri Lanka | 1,874,968 | 11.2 |
| 2021 | 4 | Fiji | 1,386,769 | 8.3 |
| 2021 | 5 | Maldives | 518,658 | 3.1 |
| 2021 | 6 | Thailand | 495,494 | 3.0 |
| 2021 | 7 | Kenya | 490,196 | 2.9 |
| 2021 | 8 | Australia | 487,207 | 2.9 |
| 2021 | 9 | Singapore | 448,804 | 2.7 |
| 2021 | 10 | Other Asia, nes | 368,828 | 2.2 |
| 2022 | 1 | Philippines | 3,439,523 | 20.4 |
| 2022 | 2 | Indonesia | 3,260,714 | 19.3 |
| 2022 | 3 | Sri Lanka | 1,920,238 | 11.4 |
| 2022 | 4 | Fiji | 1,643,175 | 9.7 |
| 2022 | 5 | Other Asia, nes | 724,342 | 4.3 |
| 2022 | 6 | Maldives | 569,906 | 3.4 |
| 2022 | 7 | Thailand | 534,141 | 3.2 |
| 2022 | 8 | Singapore | 506,466 | 3.0 |
| 2022 | 9 | Kenya | 425,452 | 2.5 |
| 2022 | 10 | Australia | 387,696 | 2.3 |
| 2023 | 1 | Indonesia | 4,372,222 | 27.7 |
| 2023 | 2 | Philippines | 1,747,920 | 11.1 |
| 2023 | 3 | Sri Lanka | 1,485,608 | 9.4 |
| 2023 | 4 | Fiji | 1,120,842 | 7.1 |
| 2023 | 5 | Other Asia, nes | 935,040 | 5.9 |
| 2023 | 6 | Thailand | 811,889 | 5.1 |
| 2023 | 7 | French Polynesia | 589,599 | 3.7 |
| 2023 | 8 | Singapore | 549,297 | 3.5 |
| 2023 | 9 | Maldives | 535,910 | 3.4 |
| 2023 | 10 | Australia | 534,753 | 3.4 |
| 2024 | 1 | Indonesia | 4,256,695 | 28.4 |
| 2024 | 2 | Philippines | 1,525,139 | 10.2 |
| 2024 | 3 | Sri Lanka | 1,458,565 | 9.7 |
| 2024 | 4 | Fiji | 965,508 | 6.4 |
| 2024 | 5 | Other Asia, nes | 748,164 | 5.0 |
| 2024 | 6 | Singapore | 650,922 | 4.3 |
| 2024 | 7 | Thailand | 640,744 | 4.3 |
| 2024 | 8 | Kiribati | 586,872 | 3.9 |
| 2024 | 9 | Australia | 554,640 | 3.7 |
| 2024 | 10 | French Polynesia | 473,979 | 3.2 |
| 2025 | 1 | Indonesia | 2,396,918 | 20.1 |
| 2025 | 2 | Philippines | 1,754,746 | 14.7 |
| 2025 | 3 | Sri Lanka | 1,099,356 | 9.2 |
| 2025 | 4 | Fiji | 721,425 | 6.1 |
| 2025 | 5 | Kiribati | 703,709 | 5.9 |
| 2025 | 6 | Thailand | 700,806 | 5.9 |
| 2025 | 7 | Singapore | 621,786 | 5.2 |
| 2025 | 8 | Other Asia, nes | 573,561 | 4.8 |
| 2025 | 9 | Australia | 413,309 | 3.5 |
| 2025 | 10 | Maldives | 402,165 | 3.4 |
| year | rank | country | value_usd | share_of_reported_pct |
|---|---|---|---|---|
| 2024 | 1 | USA | 15,003,970 | 19.7 |
| 2024 | 2 | Spain | 11,848,614 | 15.6 |
| 2024 | 3 | China | 9,442,446 | 12.4 |
| 2024 | 4 | China, Hong Kong SAR | 3,751,611 | 4.9 |
| 2024 | 5 | Italy | 3,415,434 | 4.5 |
| 2024 | 6 | Japan | 2,403,434 | 3.2 |
| 2024 | 7 | Greece | 2,353,352 | 3.1 |
| 2024 | 8 | United Kingdom | 2,171,240 | 2.9 |
| 2024 | 9 | Germany | 2,032,032 | 2.7 |
| 2024 | 10 | France | 1,791,353 | 2.4 |
| 2025 | 1 | Spain | 19,056,221 | 21.9 |
| 2025 | 2 | USA | 11,917,830 | 13.7 |
| 2025 | 3 | China | 9,389,190 | 10.8 |
| 2025 | 4 | Germany | 5,043,191 | 5.8 |
| 2025 | 5 | China, Hong Kong SAR | 4,371,222 | 5.0 |
| 2025 | 6 | Saudi Arabia | 3,977,908 | 4.6 |
| 2025 | 7 | Greece | 3,663,932 | 4.2 |
| 2025 | 8 | Japan | 2,324,158 | 2.7 |
| 2025 | 9 | United Kingdom | 2,144,250 | 2.5 |
| 2025 | 10 | Italy | 2,053,018 | 2.4 |
| year | rank | country | value_usd | share_of_reported_pct |
|---|---|---|---|---|
| 2024 | 1 | Netherlands | 14,199,012 | 22.7 |
| 2024 | 2 | Spain | 9,164,881 | 14.6 |
| 2024 | 3 | Indonesia | 7,466,115 | 11.9 |
| 2024 | 4 | Sri Lanka | 7,357,697 | 11.7 |
| 2024 | 5 | Philippines | 5,073,576 | 8.1 |
| 2024 | 6 | USA | 2,833,064 | 4.5 |
| 2024 | 7 | Australia | 2,365,792 | 3.8 |
| 2024 | 8 | Other Asia, nes | 2,258,121 | 3.6 |
| 2024 | 9 | Fiji | 1,832,856 | 2.9 |
| 2024 | 10 | France | 1,813,679 | 2.9 |
| 2025 | 1 | Netherlands | 11,819,247 | 20.0 |
| 2025 | 2 | Spain | 9,387,758 | 15.9 |
| 2025 | 3 | Indonesia | 8,278,685 | 14.0 |
| 2025 | 4 | Sri Lanka | 6,300,645 | 10.7 |
| 2025 | 5 | Philippines | 5,599,870 | 9.5 |
| 2025 | 6 | USA | 2,628,159 | 4.5 |
| 2025 | 7 | Australia | 2,383,512 | 4.0 |
| 2025 | 8 | Greece | 1,896,429 | 3.2 |
| 2025 | 9 | Fiji | 1,470,796 | 2.5 |
| 2025 | 10 | France | 1,462,361 | 2.5 |
Are most aquarium fish wild-caught or captive-bred?
Most freshwater aquarium fish are captive-bred: the 2019 Journal of Fish Biology review estimates that about 90% of tropical freshwater fish in the ornamental trade are bred in captivity and about 10% wild-caught, citing Raghavan and colleagues (2013). That corrects a common belief that the freshwater hobby still depends mainly on fish taken from rivers and lakes; the marine trade is a different picture.
Customs codes do not record whether a fish was farmed or caught, and one country can export both, so the import tables cannot split the trade this way. On the domestic side, the USDA census counted about 70.4 million freshwater egg-laying fish and 23.4 million livebearers sold by US farms in 2023, almost all from Florida. A buyer who wants to know should ask the shop, since neither customs data nor most labels say.
What does the trade data mean for people buying aquarium fish?
The trade data means that most community fish sold in the US are common, widely farmed species, so a buyer's main job is choosing fish that suit each other and the tank. The review cited above notes that about 1,000 freshwater species are widely available.
Livebearers are the clearest home-grown group: Florida farms sold 97.2% of US-farmed livebearers in 2023, so the fish in a guide to guppy tank mates are often farmed domestically. Goldfish and koi share a customs code with tropical fish, and anyone planning a coldwater tank should check which fish can live with goldfish before mixing them with tropical species. For a mixed community, the tank-mate compatibility checker compares published water ranges, temperament and size.
Trade also has an end point the customs data does not show: fish released into the wild. USGS records 170 species of non-native freshwater animals with aquarium release or the aquarium trade named as a pathway. Our data page on aquarium species established in US waters maps where they have been found. A fish that outgrows its tank should be rehomed through a shop or club, never released.
How we built this data
The source is the UN Comtrade public API (United Nations Statistics Division), annual Harmonized System data for two codes: 030111, live ornamental freshwater fish, and 030119, live ornamental fish other than freshwater, mostly marine. AquaCompat downloaded US-reported imports and exports for 2021 to 2025 by partner country, and totals for every reporting country in 2024 and 2025, on 22 October 2026.
The method is simple arithmetic. US totals use the "World" partner row; partner counts are the non-World rows. Shares divide each partner's value by the US total for that year, or, for world rankings, each country's value by the sum across reporting countries. The 2021 to 2025 change compares the two US totals directly.
The main limits are listed below.
- Values are customs declarations in current US dollars, not retail sales, and not adjusted for inflation.
- Comtrade records weight, not the number of fish.
- Imports are valued CIF (with freight and insurance) and exports FOB, so partner-reported exports to the US differ from US-reported imports. All US rows use US figures.
- HS 030111 includes koi and goldfish, so it is not a pure tropical fish series.
- HS 030119 covers all non-freshwater ornamental fish, and some reporters, such as Spain, may include non-aquarium trade.
- World rankings cover reporting countries only, and 2025 has fewer reporters than 2024.
- The freshwater share and captive-bred estimates come from a 2019 review based on a 2013 analysis; we found no newer global estimate.
How to cite this page
Please cite this page as follows.
AquaCompat, "Aquarium Fish Trade Statistics: US Imports, Exports and the World's Top Suppliers (2021–2025)", updated 22 October 2026, https://aquacompat.com/data/ornamental-fish-trade/
The data, tables and charts on this page are free to reuse under the Creative Commons Attribution 4.0 (CC BY 4.0) licence, provided you link to this page. Please also credit UN Comtrade as the original source of the trade values.
Download the data
The CSV holds every row used on this page: US imports and exports by year, code and partner, and the top reporting importers and exporters worldwide, with values in US dollars and net weight in kilograms. The charts are 1,200 by 750 pixel PNG images.
- Ornamental fish trade, US and world, 2021–2025 (CSV) CSV · 47 KB
- UN Comtrade values and weights for HS 030111 and 030119 by year, flow and partner.
- Chart: US freshwater ornamental fish imports by country, 2025 PNG · 57 KB
- Share of US import value for the top ten suppliers.
- Chart: US freshwater ornamental fish imports, 2021–2025 PNG · 47 KB
- Customs value by year, current US dollars.
Questions people ask
Which country exports the most aquarium fish?
Where do most US aquarium fish come from?
How many aquarium fish does the US import each year?
Can I reuse these trade figures and charts in an article?
Sources 6 documents from 5 publishers
- Journal of Fish Biology, Evers, Pinnegar and Taylor (Cefas and University of East Anglia) (ueaeprints.uea.ac.uk): “Where are they all from? – sources and sustainability in the ornamental freshwater fish trade”
- U.S. Geological Survey (nas.er.usgs.gov): “Nonindigenous Aquatic Species (NAS) Database, Web Services API v2 (species list and occurrence search)”; “NAS species fact sheets, 'Means of Introduction' and 'Status' sections”
- UF/IFAS Extension (Livengood and Chapman) (edis.ifas.ufl.edu): “FA124: The Ornamental Fish Trade: An Introduction with Perspectives for Responsible Aquarium Fish Ownership”
- United Nations Statistics Division, UN Comtrade (comtradeapi.un.org): “UN Comtrade public API, annual HS commodity data, codes 030111 and 030119 (reporter United States and all reporters, 2021-2025)”
- USDA National Agricultural Statistics Service (data.nass.usda.gov): “2023 Census of Aquaculture, Volume 3, Special Studies, Part 2 (AC-22-SS-2), Tables 1, 5 and 17”
All sources accessed , . Every number on this page comes from these documents.