What are the main findings?
Our screen of the USGS Nonindigenous Aquatic Species (NAS) database, run on 22 October 2026, supports these findings.
- USGS has records of 170 species of non-native freshwater animals whose NAS fact sheets name aquarium release, the aquarium trade or the pet trade as a pathway: 151 fishes, 12 snails, 4 aquatic frogs, 2 crayfish and 1 shrimp.
- Of those animals, 84 species have at least one NAS record marked established in a US state, or 92 species when Puerto Rico, Guam and the US Virgin Islands are counted.
- Florida has NAS records of 119 species of aquarium-pathway animals, with established-status records for 54 species, and holds about 38% of all such animal records in the US.
- Hawaii ranks second, with 55 species recorded and 38 species with established-status records.
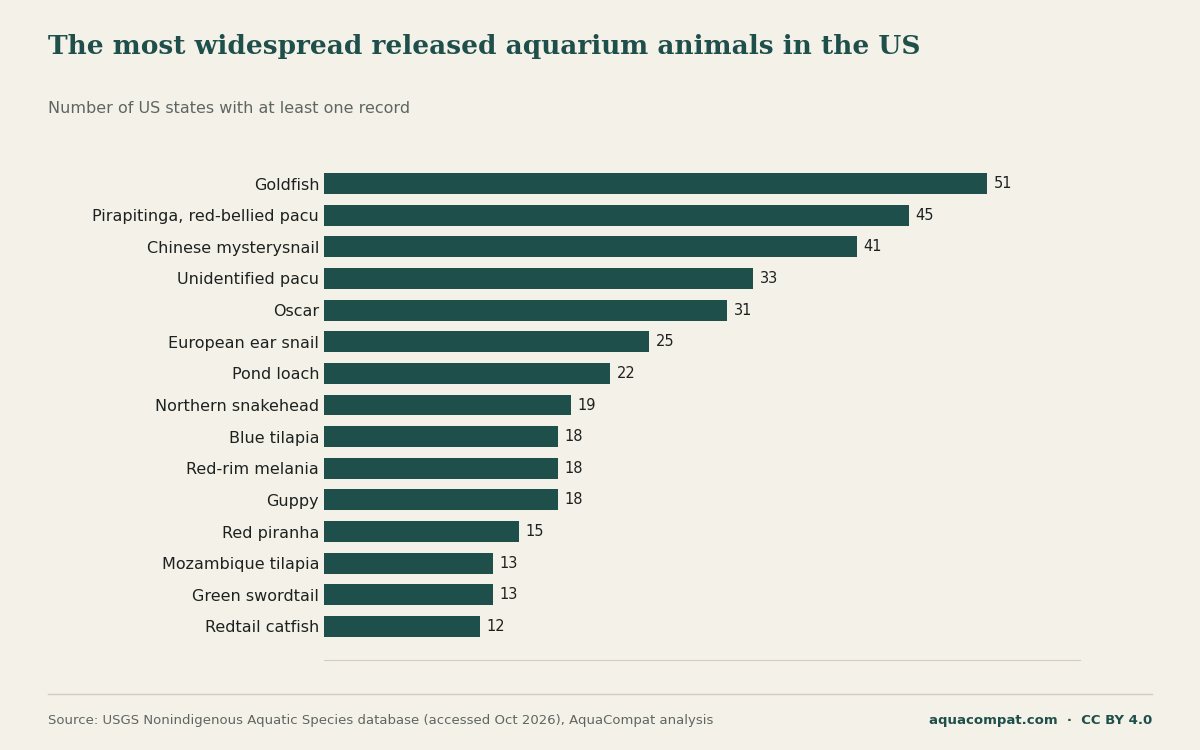
- Goldfish have NAS records in 51 states (incl. DC) and established-status records in 44 states plus DC, the widest range of any aquarium-pathway animal.
- Cichlids are the largest family on the list, at 41 species.
- NAS logged 15,203 records of aquarium-pathway animals dated 2016-2025, up 35% on 2006-2015, a rise that reflects reporting effort as well as spread.
- Zebra mussels were found in aquarium moss balls sold in 46 states by April 2021, according to the US Fish and Wildlife Service.
How many aquarium and pet-trade species have been found in US waters?
At least 170 species of non-native freshwater animals with an aquarium or pet-trade pathway have been recorded in US waters, plus 19 species of aquatic plants. An aquarium-pathway species, as used here, is a non-native species whose USGS NAS fact sheet names aquarium release, the aquarium trade or the pet trade among the ways it arrived.
The animal list breaks down into five groups: 151 fishes, 12 snails, 4 aquatic frogs, 2 crayfish and 1 shrimp.
- The fishes range from goldfish and guppies to sailfin plecos and oscars.
- Seven of the snails are apple snails.
- The frogs are all clawed frogs and their relatives (family Pipidae).
- The single shrimp is the cherry shrimp.
These animals account for 37,974 records in US states and territories. Treat that total as a floor: species without NAS pathway text could not be screened, so some aquarium species are missing.
Which released aquarium species are established in the wild?
84 species of aquarium-pathway animals have at least one NAS record marked established or locally established in a US state. Among animals, goldfish lead with established-status records in 44 states plus DC; among plants, Eurasian watermilfoil and Brazilian waterweed have the widest established ranges.
- Eurasian watermilfoil48
- Goldfish45
- Brazilian waterweed34
- Chinese mysterysnail32
- dotted duckweed25
- Pond Loach16
- whorled hydrilla14
- red-rim melania14
- water lettuce13
- giant salvinia12
- Blue Tilapia11
- Guppy11
- European ear snail11
- Green Swordtail11
- giant applesnail10
Established = at least one NAS record with status 'established' or 'locally established' in that state. Territories are not counted. Full list in the CSV below.
Does a fish found in a lake mean it is breeding there?
No, a single record usually shows one released or escaped fish, not a breeding population. The red-bellied pacu (pirapitinga) has been recorded in 45 states, second only to goldfish among animals, yet has no established-status record in any of them. The red piranha has records in 15 states and none established.
A common misreading of NAS maps is to treat every dot as an invasion. Writers using these figures should report "recorded in" and "established in" as separate counts; the CSV gives both for every species.
Which US states have the most released aquarium species?
Florida has the most aquarium-pathway animals by a wide margin: NAS holds records of 119 species there, 54 species with established-status records, and Florida accounts for about 38% (14,525 records) of all aquarium-pathway animal records in the US. Hawaii follows with 55 species recorded and 38 species established. Texas (43 recorded, 25 established), California (40 and 21) and Puerto Rico (39 and 31) come next.
The leaders are mostly warm states and islands. Florida also hosts most US ornamental fish farms, and the NAS fact sheets for the oscar and the vermiculated sailfin catfish trace early Florida records to fish farms rather than home aquariums. The figures on US ornamental fish farms show how concentrated that industry is.
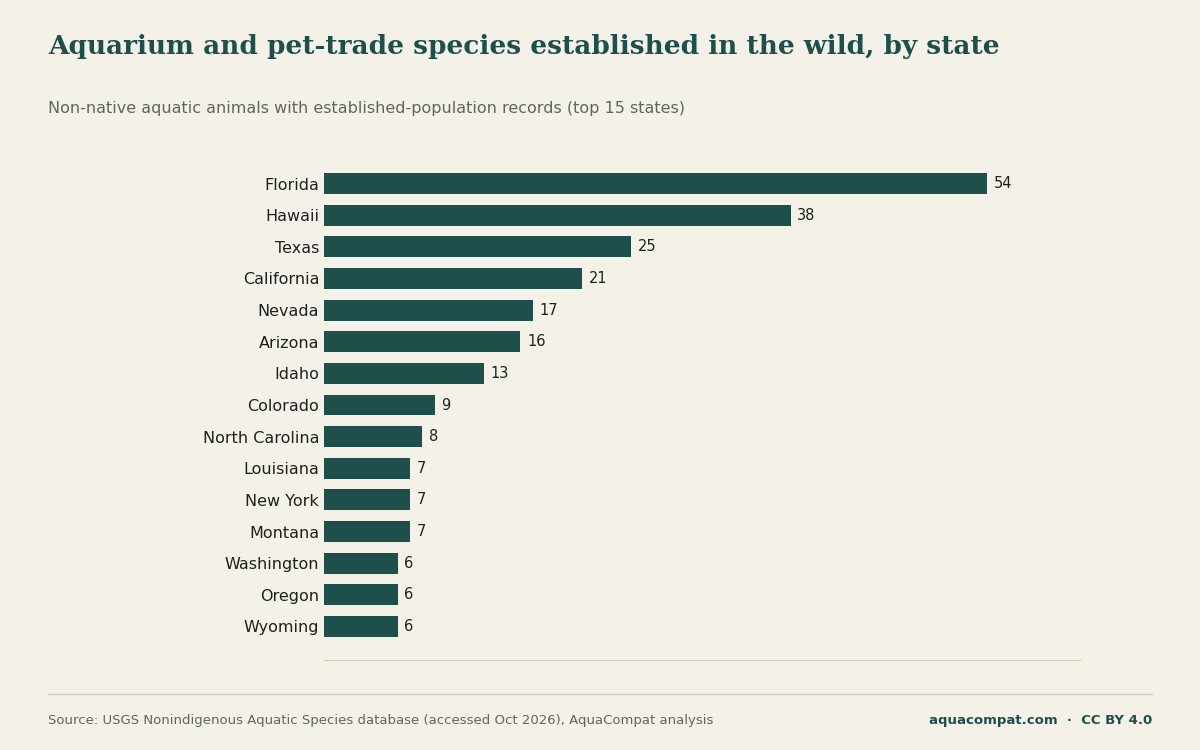
| state | type | animal_records | animal_species_recorded | animal_species_established | all_records | all_species_recorded | all_species_established |
|---|---|---|---|---|---|---|---|
| Florida | state | 14,525 | 119 | 54 | 32,820 | 132 | 64 |
| Hawaii | state | 1,217 | 55 | 38 | 1,281 | 61 | 43 |
| Texas | state | 1,325 | 43 | 25 | 3,028 | 52 | 34 |
| California | state | 969 | 40 | 21 | 1,920 | 48 | 26 |
| Puerto Rico | territory | 479 | 39 | 31 | 536 | 44 | 35 |
| Nevada | state | 320 | 34 | 17 | 343 | 35 | 18 |
| Arizona | state | 460 | 25 | 16 | 1,392 | 32 | 19 |
| Louisiana | state | 332 | 22 | 7 | 1,120 | 30 | 14 |
| North Carolina | state | 223 | 19 | 8 | 309 | 27 | 16 |
| Utah | state | 98 | 19 | 4 | 109 | 21 | 5 |
| New York | state | 1,577 | 17 | 7 | 23,880 | 21 | 10 |
| Massachusetts | state | 120 | 17 | 2 | 327 | 22 | 5 |
| Idaho | state | 114 | 17 | 13 | 576 | 21 | 16 |
| Colorado | state | 80 | 17 | 9 | 159 | 20 | 10 |
| Georgia | state | 285 | 16 | 5 | 469 | 24 | 13 |
| Pennsylvania | state | 1,633 | 14 | 3 | 2,476 | 20 | 7 |
| Illinois | state | 1,242 | 14 | 4 | 1,736 | 20 | 8 |
| Washington | state | 198 | 14 | 6 | 1,737 | 17 | 9 |
| Alabama | state | 84 | 14 | 4 | 359 | 23 | 12 |
| Montana | state | 59 | 12 | 7 | 97 | 13 | 8 |
| Minnesota | state | 387 | 11 | 2 | 1,174 | 15 | 4 |
| South Carolina | state | 274 | 11 | 3 | 510 | 20 | 11 |
| Indiana | state | 180 | 11 | 3 | 464 | 14 | 5 |
| Virginia | state | 2,725 | 10 | 4 | 2,849 | 19 | 8 |
| Ohio | state | 2,316 | 10 | 2 | 2,744 | 17 | 7 |
| Wisconsin | state | 1,398 | 10 | 3 | 3,162 | 13 | 5 |
| Connecticut | state | 45 | 10 | 2 | 1,488 | 13 | 5 |
| Maryland | state | 2,013 | 9 | 3 | 2,122 | 15 | 8 |
| New Jersey | state | 332 | 9 | 5 | 431 | 14 | 9 |
| Oregon | state | 116 | 9 | 6 | 819 | 14 | 9 |
| Missouri | state | 114 | 9 | 2 | 173 | 17 | 5 |
| Mississippi | state | 78 | 9 | 3 | 362 | 19 | 11 |
| Nebraska | state | 49 | 9 | 1 | 74 | 11 | 2 |
| Wyoming | state | 75 | 8 | 6 | 75 | 8 | 6 |
| Guam | territory | 74 | 8 | 1 | 90 | 11 | 3 |
| Oklahoma | state | 59 | 8 | 2 | 125 | 14 | 6 |
| Michigan | state | 612 | 7 | 4 | 2,141 | 11 | 7 |
| Arkansas | state | 190 | 7 | 1 | 284 | 14 | 6 |
| Kentucky | state | 46 | 7 | 2 | 88 | 12 | 6 |
| Kansas | state | 37 | 7 | 2 | 71 | 11 | 5 |
| South Dakota | state | 46 | 6 | 3 | 55 | 7 | 4 |
| Tennessee | state | 35 | 6 | 1 | 117 | 12 | 5 |
| Vermont | state | 16 | 6 | 1 | 212 | 8 | 2 |
| Iowa | state | 53 | 5 | 1 | 413 | 9 | 3 |
| New Mexico | state | 32 | 5 | 3 | 52 | 8 | 5 |
| District of Columbia | district | 984 | 4 | 2 | 990 | 8 | 3 |
| Delaware | state | 118 | 4 | 2 | 137 | 8 | 5 |
| New Hampshire | state | 67 | 4 | 2 | 111 | 8 | 5 |
| Maine | state | 54 | 4 | 1 | 155 | 6 | 2 |
| West Virginia | state | 51 | 4 | 3 | 55 | 6 | 5 |
| U.S. Virgin Islands | territory | 20 | 4 | 2 | 24 | 6 | 4 |
| Rhode Island | state | 18 | 4 | 1 | 29 | 8 | 4 |
| Alaska | state | 16 | 4 | 0 | 16 | 4 | 0 |
| North Dakota | state | 4 | 3 | 1 | 7 | 4 | 2 |
Why do some states have many records but few species?
Record totals and species totals measure different things. New York has 23,880 aquarium-pathway records including plants, but only 1,577 animal records, covering 17 species. Virginia and Ohio each have more than 2,000 animal records but only ten animal species. Compare states by species, not records.
Which aquarium animals are the most widespread in the US?
Goldfish are the most widespread aquarium-pathway animal in US waters, with NAS records in 51 states (incl. DC) and 6,597 records in total. The USGS goldfish fact sheet lists aquarium releases among recent introduction routes, alongside pond and hatchery escapes and bait releases, so not every wild goldfish began as a pet.
A goldfish bought small can reach 10 in (25.4 cm) and can live 6–20 years, according to OATA and fishkeeping.co.uk figures in our species data, and a single-tail adult needs about 48 US gal (182 L). Planning for that size before buying, and choosing cool-water companions for goldfish, keeps the fish from outgrowing its tank.
Which popular aquarium fish, snails and shrimp appear in the data?
Plecos, cichlids, livebearers, apple snails and cherry shrimp all appear in the NAS data.
Plecos
Suckermouth armored catfishes (family Loricariidae, 12 NAS taxa) have records in 16 states and established-status records in six: California, Florida, Hawaii, Nevada, North Carolina and Texas, plus Puerto Rico. Most are large sailfin plecos; USGS gives the vermiculated sailfin catfish a size of 70 cm. The bristlenose pleco reaches only 5 in (12.7 cm), and NAS has a handful of Ancistrus records. Its needs are covered in the bristlenose pleco tank-mate guide.
Cichlids
Cichlids are the largest family, at 41 species. The oscar has records in 31 states but established-status records only in Florida and Hawaii, plus Puerto Rico, and the USGS oscar fact sheet, which records failed introductions in 21 states, notes that oscars grow large in aquaria and are likely to be released. An adult reaches 14 in (35.6 cm), which is why our oscar tank-mate guide starts from a 75 US gal (284 L) tank. Lake Malawi mbuna, the fish of an African cichlid community, mostly have five or fewer records each.
Livebearers
The guppy has records in 18 states and established-status records in 11; the green swordtail has 13 and 11. Suitable companions are listed in the guppy community tank guide.
Apple snails
The giant applesnail (Pomacea maculata) has 3,321 records in 11 states, ten with established-status records; its NAS fact sheet says it was likely introduced via the aquarium trade. The snail sold as the mystery snail, Pomacea diffusa, is far less widespread: USGS lists it as established in Florida and Hawaii. Our guide to aquarium snails covers the species kept in home tanks.
Cherry shrimp
Cherry shrimp have NAS records in two states and are established in one. USGS reports them established on O'ahu, Hawaii, since the 1990s, names aquarium releases as the main pathway, and notes a 2025 USFWS screening that rated the species high risk. A colony can start from the cherry shrimp tank-mate list.
Are aquarium plants on the list too?
Yes: 19 species of non-native aquatic plants have NAS fact sheets naming the aquarium trade as a pathway, including hydrilla, Brazilian waterweed, giant salvinia and water lettuce; 15 species have established-status records in a US state. They are counted separately because their fact sheets usually name the aquarium trade as one route among several, so their large record counts cannot be attributed to home aquariums.
Indian swampweed (Hygrophila polysperma), a stem plant, has established-status records in five states. Anyone setting up a planted aquarium can check plant names against the CSV below.
Are aquarium releases in the US increasing?
NAS records of aquarium-pathway animals have risen, but that does not prove releases have increased: NAS logged 15,203 records dated 2016-2025, up from 11,271 records in 2006-2015, a 35% increase.
Records are sightings someone reported and USGS compiled. More surveys and better reporting can raise the count with no change in releases, so treat the trend as unproven.
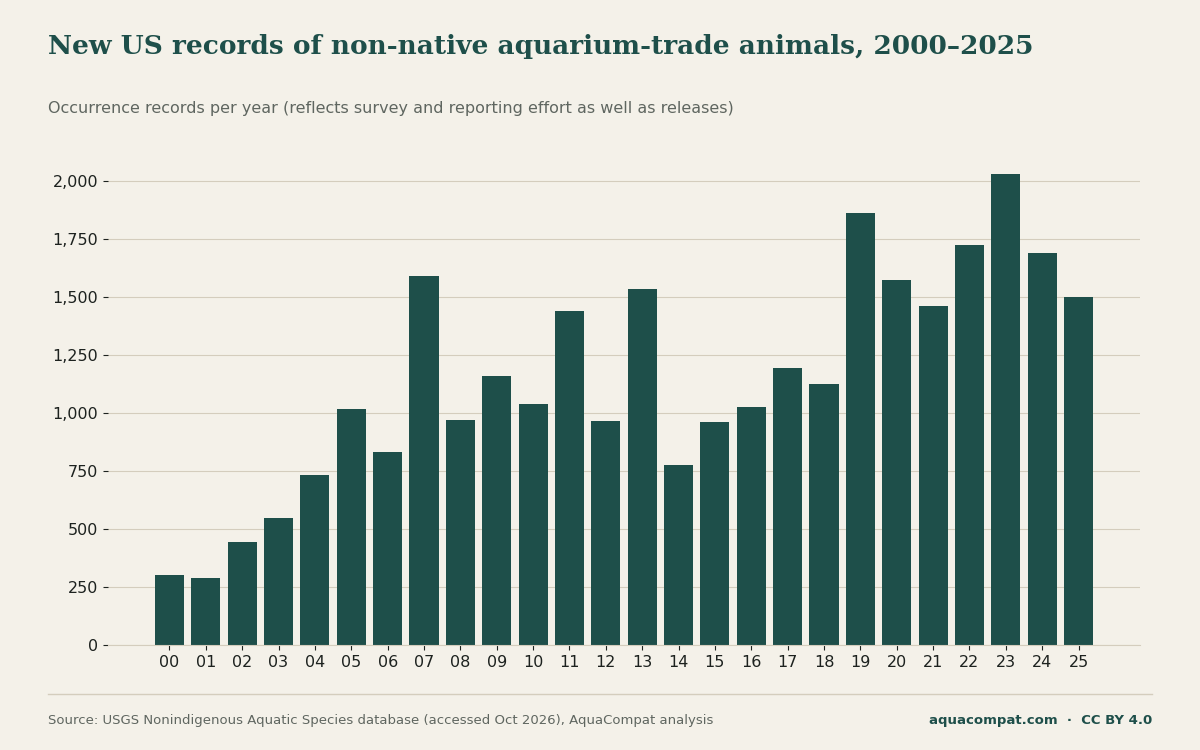
| year | animals | plants | goldfish | plecos_loricariidae | cichlids | livebearers_poeciliidae | apple_snails_ampullariidae |
|---|---|---|---|---|---|---|---|
| 2000 | 301 | 687 | 73 | 18 | 83 | 30 | 17 |
| 2001 | 288 | 747 | 80 | 18 | 68 | 4 | 3 |
| 2002 | 445 | 911 | 76 | 29 | 135 | 29 | 3 |
| 2003 | 546 | 722 | 62 | 16 | 238 | 40 | 3 |
| 2004 | 734 | 1,045 | 52 | 28 | 365 | 36 | 27 |
| 2005 | 1,018 | 1,098 | 52 | 23 | 257 | 86 | 235 |
| 2006 | 831 | 1,529 | 89 | 37 | 231 | 23 | 76 |
| 2007 | 1,591 | 1,540 | 79 | 53 | 214 | 29 | 126 |
| 2008 | 970 | 997 | 94 | 27 | 105 | 9 | 121 |
| 2009 | 1,161 | 894 | 62 | 28 | 87 | 1 | 142 |
| 2010 | 1,039 | 1,421 | 73 | 12 | 106 | 3 | 126 |
| 2011 | 1,440 | 1,088 | 55 | 18 | 102 | 17 | 140 |
| 2012 | 964 | 1,252 | 40 | 18 | 113 | 5 | 161 |
| 2013 | 1,537 | 1,407 | 81 | 14 | 365 | 1 | 181 |
| 2014 | 777 | 2,365 | 72 | 7 | 172 | 3 | 186 |
| 2015 | 961 | 3,613 | 97 | 27 | 188 | 6 | 225 |
| 2016 | 1,028 | 1,815 | 117 | 14 | 332 | 20 | 229 |
| 2017 | 1,196 | 1,504 | 128 | 7 | 434 | 21 | 221 |
| 2018 | 1,127 | 970 | 174 | 12 | 406 | 34 | 120 |
| 2019 | 1,865 | 3,010 | 188 | 10 | 568 | 39 | 231 |
| 2020 | 1,576 | 3,790 | 60 | 2 | 394 | 24 | 300 |
| 2021 | 1,461 | 2,461 | 238 | 11 | 597 | 37 | 156 |
| 2022 | 1,727 | 4,402 | 320 | 7 | 787 | 32 | 135 |
| 2023 | 2,033 | 2,816 | 239 | 11 | 754 | 61 | 113 |
| 2024 | 1,691 | 1,479 | 254 | 11 | 941 | 81 | 95 |
| 2025 | 1,499 | 596 | 183 | 15 | 816 | 143 | 125 |
How did zebra mussels end up in aquarium moss balls?
Zebra mussels were found in Marimo moss balls sold for aquariums in March 2021: USGS confirmed the first report, from a Seattle pet store, on March 2, 2021, and by April 27, 2021 contaminated moss balls had turned up in 46 states, according to the US Fish and Wildlife Service. The USGS zebra mussel fact sheet gives an earlier figure of 29 states.
Zebra mussels are listed as injurious wildlife under 50 CFR 16.13, so importing them requires a USFWS permit. In a March 2022 notice, the Service warned that dumping contaminated moss balls, or the water they came in, into waterways or storm drains violates injurious wildlife rules.
Zebra mussels are not in the animal count above, because their aquarium link is contaminated stock, not release by fishkeepers.
What should fishkeepers do instead of releasing a fish?
Fishkeepers should never put aquarium animals, plants or tank water into a pond, stream or storm drain; the clearest federal statement in our sources is the USFWS warning that dumping contaminated moss balls or their water there breaks injurious wildlife rules. Our sources do not set out a rehoming procedure, so we do not give one.
Oscars, sailfin plecos, pacus and goldfish all grow far larger than they are when sold. Checking adult size before buying, and using the tank compatibility checker to avoid mixes that fail, addresses the size problem the oscar fact sheet describes. Import values for the fish entering this trade are in our US aquarium fish trade statistics.
How we built this data
All counts come from the USGS Nonindigenous Aquatic Species database. On 22 October 2026 AquaCompat downloaded the NAS species list and occurrence records through the NAS Web Services API (version 2), plus each species fact sheet.
The method had four steps.
- We took every freshwater taxon NAS classes as exotic or cryptogenic: 535 taxa in all.
- We retained those whose fact sheet 'Means of Introduction' text mentions an aquarium, aquaria, aquarists, or pet release or trade.
- We removed false positives by hand, including terrestrial vivarium frogs, the rudd (specimens from a public aquarium), the blotched snakehead (food-fish release) and the zebra mussel.
- We counted records, states with records and states with established-status records per species, state and year, excluding Canada.
The data have known limits.
- 167 taxa of the 535 taxa have no pathway text on NAS, so aquarium species without a full profile are missed; four fact sheets returned a server error.
- Pathway wording ranges from documented releases to possible or probable routes, and many species also arrived via fish farms, food markets or stocking.
- Established means at least one record, at any date, with status established or locally established; some populations may since have died out.
- Records reflect survey and reporting effort, not population size.
- Native species moved outside their range, such as the red swamp crayfish, are excluded.
Some figures differ from fact-sheet summaries quoted elsewhere on this site (accessed 21 October 2026). The goldfish sheet gives 49 US states, every state except Alaska; our occurrence count gives 51 because NAS holds goldfish records in Alaska, though none established. The guppy sheet, revised in 2013, lists guppies as locally established in 6 states, while 2026 occurrence records carry an established status in 11; we did not trace each record. This page uses the occurrence data as primary.
How to cite this page
AquaCompat, "Released Aquarium Fish and Pets in US Waters: Invasive Species Data by State (USGS)", updated 22 October 2026, https://aquacompat.com/data/invasive-aquarium-species/. Underlying data: USGS Nonindigenous Aquatic Species database, accessed 22 October 2026.
The data, tables and charts on this page are free to reuse under a Creative Commons Attribution 4.0 (CC BY 4.0) licence, with a link to this page. Please also credit USGS NAS as the original source.
Download the data
The species CSV has one row per taxon, animals and plants, with record counts, the states with records and with established-status records, first and latest year recorded, the NAS pathway text and a link to each fact sheet. The charts are 1,200 by 750 pixel PNG images.
- Aquarium-pathway species in US waters (CSV) CSV · 54 KB
- 189 taxa with records, states, established states, years, pathway text and NAS fact sheet links.
- Records and species by state and territory (CSV) CSV · 2 KB
- Animal and all-taxa records, species recorded and species established for 50 states, DC and territories.
- Records by year, 2000-2025 (CSV) CSV · 1 KB
- Animal and plant records per year, with goldfish, plecos, cichlids, livebearers and apple snails.
- Chart: established aquarium species by state PNG · 61 KB
- Top 15 states by animal species with established-status records.
- Chart: most widespread released aquarium animals PNG · 70 KB
- Top 15 animals by number of states with records.
- Chart: records of aquarium-trade animals per year PNG · 53 KB
- NAS occurrence records, 2000-2025.
Questions people ask
Is the USGS count the total number of aquarium species released in the US?
Why does the state chart leave out Puerto Rico?
Are cherry shrimp a risk outside Hawaii?
Sources 25 documents from 10 publishers
- Aquarium Co-Op (aquariumcoop.com): “Care Guide for Fancy Goldfish”; “Oscar Fish Care Guide”
- FishBase (fishbase.se): “Carassius auratus, Goldfish: species summary”; “Astronotus ocellatus, Oscar: species summary”
- fishkeeping.co.uk (fishkeeping.co.uk): “Goldfish Size, Life Expectancy and Tank Recommendations”; “Keeping Goldfish - The Right Way”
- Ornamental Aquatic Trade Association (OATA) (ornamentalfish.org): “How to look after goldfish in an aquarium / fish tank”; “How to look after fancy goldfish”
- PlanetCatfish (via Internet Archive snapshot, 2025) (web.archive.org): “Ancistrus sp. (3) Common Bristlenose Catfish Cat-eLog data sheet”
- Seriously Fish (seriouslyfish.com): “Ancistrus sp. '3' (Common Bristlenose Catfish)”; “Astronotus ocellatus”
- U.S. Fish and Wildlife Service (fws.gov): “Invasive Zebra Mussels Found in Moss Balls”
- U.S. Fish and Wildlife Service, Office of Law Enforcement (fws.gov): “Notice to the Wildlife Import/Export Community: Invasive Zebra Mussels Found in Aquarium Moss Balls (March 8, 2022)”
- U.S. Geological Survey (nas.er.usgs.gov): “Nonindigenous Aquatic Species (NAS) Database, Web Services API v2 (species list and occurrence search)”; “NAS species fact sheets, 'Means of Introduction' and 'Status' sections”; “Carassius auratus (goldfish) - Species Profile”; “Dreissena polymorpha (zebra mussel) - Species Profile”; “Pterygoplichthys disjunctivus (Vermiculated Sailfin Catfish) species profile, Nonindigenous Aquatic Species Database”; “Astronotus ocellatus (Oscar) species profile, Nonindigenous Aquatic Species Database”; “Pomacea diffusa (spike-topped applesnail) species profile, Nonindigenous Aquatic Species Database”; “Neocaridina davidi (cherry shrimp) species profile, Nonindigenous Aquatic Species Database”; “Carassius auratus (Goldfish) species profile, Nonindigenous Aquatic Species Database”; “Poecilia reticulata (Guppy) species profile, Nonindigenous Aquatic Species Database”
- USDA National Agricultural Statistics Service (data.nass.usda.gov): “2023 Census of Aquaculture, Volume 3, Special Studies, Part 2 (AC-22-SS-2), Tables 1, 5 and 17”; “2018 Census of Aquaculture, Volume 3, Special Studies, Part 2 (AC-17-SS-2), Table 17”
All sources accessed , . Every number on this page comes from these documents.