What are the main findings?
The USDA Census of Aquaculture, run every five years by the National Agricultural Statistics Service, is the only national count of US farms that raise fish for aquariums and ponds. Its 2023 edition supports these findings.
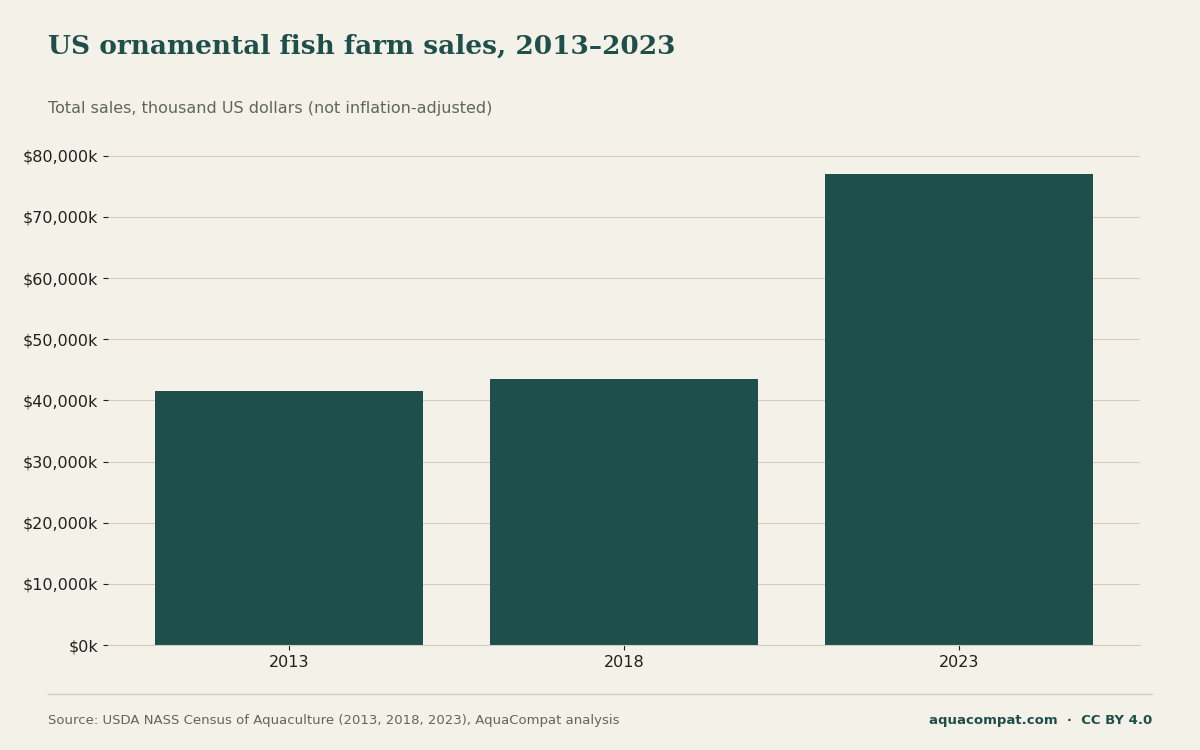
- US ornamental fish farms sold $77.1 million of fish in 2023, up from $43.5 million in 2018, in current dollars (USDA 2023 Census of Aquaculture).
- The census counted 315 farms selling ornamental fish in 2023, against 263 farms in 2018 and 285 farms in 2013.
- Florida farms produced 75% of US ornamental fish sales in 2023 and had 161 farms, about half the national total.
- US farms sold about 70.4 million freshwater egg-laying aquarium fish in 2023, and 99.9% of them came from Florida.
- Florida farms sold 97.2% of the 23.4 million freshwater livebearers sold by US farms in 2023.
- Koi were the most widely farmed ornamental type in 2023, sold by 138 farms, worth $12.3 million in total.
- The average farm-gate price of a US-farmed freshwater egg layer was $0.38 per fish in 2023, up from $0.24 per fish in 2018.
- Farmed saltwater ornamental fish brought in $19.5 million in 2023 from 29 farms, more than double their 2018 sales.
How many ornamental fish farms are there in the US, and what do they sell?
There were 315 farms in the US selling ornamental fish in 2023, with combined sales of $77.1 million, according to the USDA 2023 Census of Aquaculture. Ornamental fish are fish raised for aquariums and ponds rather than food or bait, and USDA splits them into six groups: freshwater egg layers, freshwater livebearers, goldfish, koi, saltwater ornamental fish and a catch-all "other" group.
The table gives every group for the three most recent census years. A single farm can sell several types, so the farm counts by type add up to more than the national total. A dash marks a figure USDA withheld to avoid revealing a single farm's business, or did not publish.
| Census year | Type | Farms | Fish sold (thousands) | Sales ($1,000) | Average price per fish ($) |
|---|---|---|---|---|---|
| 2023 | All ornamental fish | 315 | – | 77,095 | – |
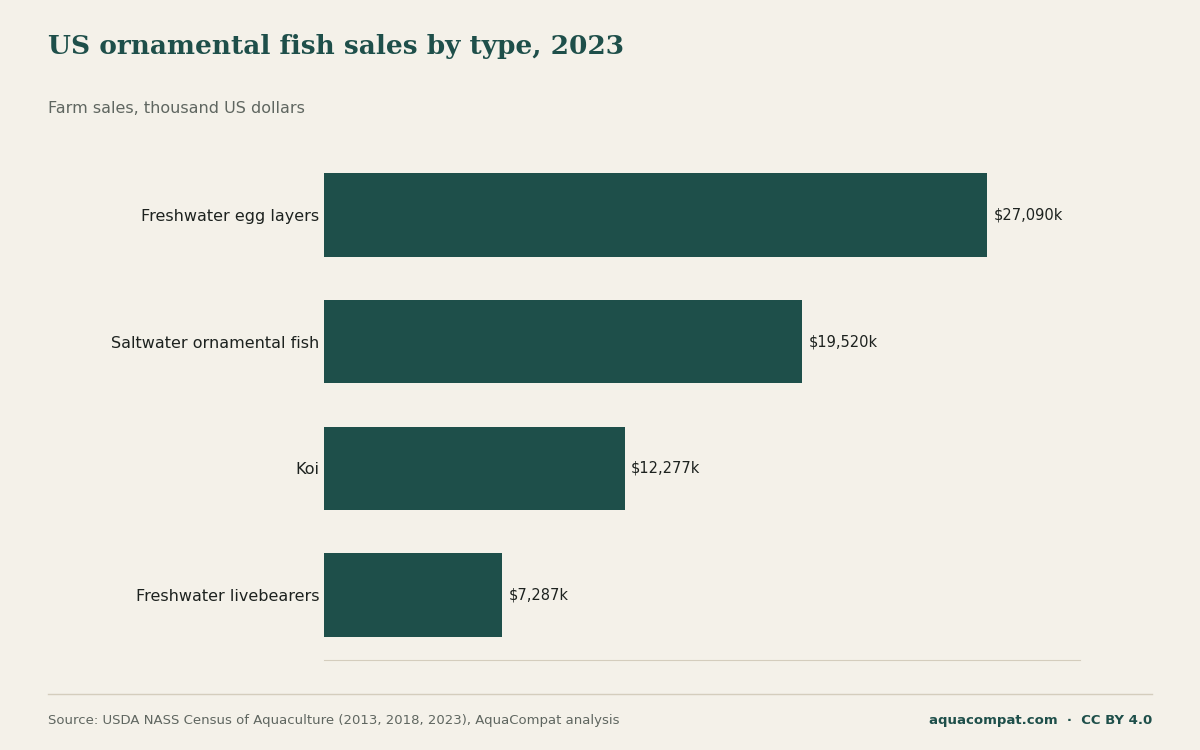
| 2023 | Freshwater egg layers | 101 | 70,417 | 27,090 | 0.38 |
| 2023 | Freshwater livebearers | 84 | 23,438 | 7,287 | 0.31 |
| 2023 | Goldfish | 66 | – | – | – |
| 2023 | Koi | 138 | 1,436 | 12,277 | 8.55 |
| 2023 | Saltwater ornamental fish | 29 | 1,385 | 19,520 | 14.09 |
| 2023 | Other ornamental fish | 40 | – | – | – |
| 2018 | All ornamental fish | 263 | – | 43,534 | – |
| 2018 | Freshwater egg layers | 77 | 73,307 | 17,709 | 0.24 |
| 2018 | Freshwater livebearers | 43 | 13,892 | 2,300 | 0.17 |
| 2018 | Goldfish | 54 | – | – | – |
| 2018 | Koi | 149 | 1,181 | 8,141 | 6.89 |
| 2018 | Saltwater ornamental fish | 28 | 1,513 | 8,857 | 5.85 |
| 2018 | Other ornamental fish | 31 | – | – | – |
| 2013 | All ornamental fish | 285 | – | 41,485 | – |
| 2013 | Freshwater egg layers | 92 | 70,053 | 16,076 | 0.23 |
| 2013 | Freshwater livebearers | 80 | 77,756 | 2,927 | 0.04 |
| 2013 | Goldfish | 42 | 81,336 | 4,136 | 0.05 |
| 2013 | Koi | 149 | 1,513 | 6,898 | 4.56 |
| 2013 | Saltwater ornamental fish | 16 | 1,056 | 10,323 | 9.77 |
| 2013 | Other ornamental fish | 28 | – | 1,124 | – |
What does the farm count mean for fishkeepers?
The farm count means that a few hundred businesses supply the domestically bred fish sold in US shops. The census does not record why farms opened or closed between 2013, 2018 and 2023.
For someone planning a tank, the practical point is that common community fish are mostly farm products. A 2019 Journal of Fish Biology review by Cefas and University of East Anglia scientists estimates that about 90% of tropical freshwater fish in the global ornamental trade are captive bred, citing a 2013 analysis by Raghavan and colleagues. The same review puts the fish on sale worldwide at more than 5,300 freshwater and 1,802 marine species, so farming is concentrated in a fairly small set of popular species, the ones our fish compatibility checker covers best. Imported fish are counted separately, by customs value, in our aquarium fish import statistics.
Which states farm the most ornamental fish?
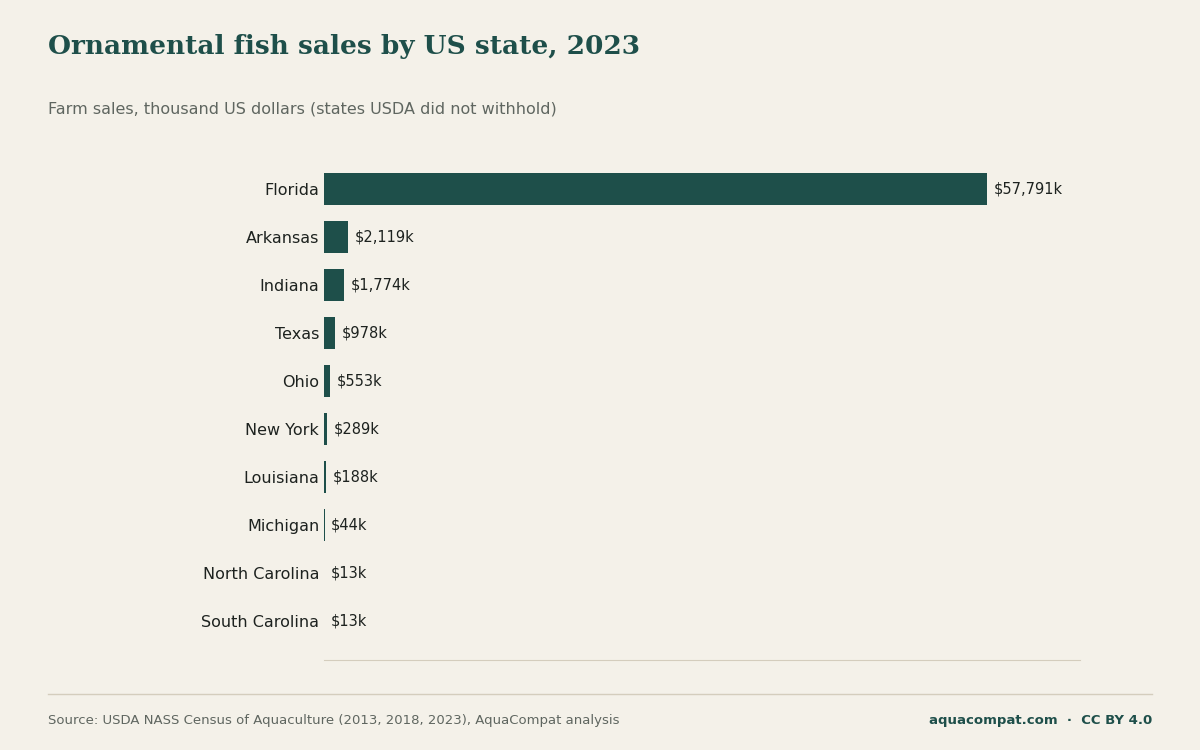
Florida farms the most ornamental fish by a wide margin: its 161 farms sold $57.8 million of fish in 2023, or 75% of the US total, according to USDA Census of Aquaculture Table 17. No other state with a published figure passed $2.2 million. Ohio had the second-largest number of farms, 26, but its published sales were far smaller, at $553,000.
Florida's lead has grown. AquaCompat's calculation from the same USDA tables puts Florida's share of national sales in 2013, 2018 and 2023 at 65.4, 66.0, 75.0% respectively.
- Florida161
- Ohio26
- Hawaii12
- New York11
- New Jersey10
- Texas10
- Louisiana9
- Pennsylvania7
- Maryland6
- Indiana5
- Nebraska5
- California4
- Michigan4
- Oklahoma4
- Virginia4
Farms selling ornamental fish in 2023. States not shown had three or fewer farms; see the full table below.
| State | Farms 2023 | Farms 2018 | Farms 2013 | Sales 2023 ($1,000) | Sales 2018 ($1,000) | Sales 2013 ($1,000) |
|---|---|---|---|---|---|---|
| Florida | 161 | 109 | 127 | 57,791 | 28,721 | 27,128 |
| Ohio | 26 | 13 | 8 | 553 | 144 | 113 |
| Hawaii | 12 | 15 | 14 | – | – | – |
| New York | 11 | 8 | 4 | 289 | 108 | – |
| New Jersey | 10 | 5 | 5 | – | 202 | – |
| Texas | 10 | 15 | 4 | 978 | 636 | 42 |
| Louisiana | 9 | 4 | 4 | 188 | – | – |
| Pennsylvania | 7 | 8 | 16 | – | 808 | 615 |
| Maryland | 6 | 3 | 2 | – | 232 | – |
| Indiana | 5 | 3 | 1 | 1,774 | – | – |
| Nebraska | 5 | 3 | 4 | 9 | 2 | – |
| California | 4 | 7 | 18 | – | – | – |
| Michigan | 4 | 4 | 6 | 44 | – | – |
| Oklahoma | 4 | 1 | 3 | – | – | – |
| Virginia | 4 | 6 | 3 | – | – | – |
| Arkansas | 3 | 6 | 6 | 2,119 | – | 1,598 |
| Illinois | 3 | 3 | 2 | – | 40 | – |
| Missouri | 3 | 5 | 10 | – | – | 1,690 |
| North Carolina | 3 | 7 | 10 | 13 | – | – |
| South Carolina | 3 | 4 | 2 | 13 | – | – |
| Wisconsin | 3 | 3 | 4 | 3 | – | 8 |
| Alabama | 2 | 2 | 0 | – | – | 0 |
| Delaware | 2 | 0 | – | – | 0 | – |
| Kentucky | 2 | 6 | 2 | – | – | – |
| Maine | 2 | 0 | 1 | – | 0 | – |
| Minnesota | 2 | 1 | 1 | – | – | – |
| Oregon | 2 | 3 | 4 | – | 18 | 19 |
| Washington | 2 | 0 | 4 | – | 0 | 25 |
| Iowa | 1 | 1 | 1 | – | – | – |
| New Hampshire | 1 | 1 | 3 | – | – | 38 |
| Rhode Island | 1 | 2 | 0 | – | – | 0 |
| Tennessee | 1 | 6 | 4 | – | – | – |
| West Virginia | 1 | 1 | 3 | – | – | 8 |
| Arizona | – | – | 3 | – | – | 6 |
| Connecticut | 0 | 6 | 0 | 0 | 69 | 0 |
| Idaho | 0 | 2 | 2 | 0 | – | – |
| Massachusetts | – | – | 2 | – | – | – |
| Mississippi | – | – | 1 | – | – | – |
| New Mexico | – | – | 1 | – | – | – |
Why does Florida's share matter when you buy fish?
Florida's share matters because most US-farmed tropical fish come out of one climate and one water supply. Aquarium Co-Op notes that captive-bred angelfish in the United States come from hard Florida water but adapt to softer water, and Seriously Fish reports that commercially farmed neon tetras are more adaptable than wild fish. Our page on general and carbonate hardness explains how to read those figures against your own tap supply, and the angelfish tank-mate list shows which companions share their range. Many other states have only one to five farms, and USDA withholds their sales.
Which kinds of ornamental fish do US farms raise?
Freshwater egg layers earn the most money, with sales of $27.1 million in 2023, followed by saltwater ornamental fish at $19.5 million, koi at $12.3 million and freshwater livebearers at $7.3 million, according to USDA Census of Aquaculture Table 5. The census does not name species within each group. Egg layers is USDA's category for tropical fish that lay eggs, such as tetras, barbs, gouramis and cichlids. Livebearers covers fish that give birth to free-swimming young, such as guppies, platies, mollies and swordtails.
How do egg layers, livebearers, koi, goldfish and saltwater fish compare?
Egg layers lead on volume, koi lead on farm numbers and saltwater fish lead on value per fish. The groups differ enough to take one at a time.
Freshwater egg layers
US farms sold about 70.4 million egg-laying aquarium fish in 2023, and 99.9% came from 94 Florida farms. The number sold has barely moved since 2013, while sales value rose, so the growth in this group came from a higher average price rather than more fish.
Freshwater livebearers
The census counted 23.4 million livebearers sold in 2023, 97.2% of them from Florida. In 2013 US farms sold more than three times as many livebearers but at an average of 4 cents each. Guppies are the best-known fish in this group; the fish that live well with guppies are listed on their own page.
Koi
Koi had the most farms of any ornamental type in 2023: 138 farms sold 1.44 million koi, according to USDA Census of Aquaculture Table 5. Koi farming is spread across many states; Florida had 29 of those farms.
Goldfish
Goldfish were sold by 66 farms in 2023, but USDA withheld the national number and value, so goldfish cannot be ranked against the other groups. The last published national total is from 2013, when 42 farms sold 81.3 million goldfish worth $4.1 million, an average of about 5 cents a fish. Their care needs differ from tropical fish, and the goldfish companion list explains why.
Saltwater ornamental fish
Saltwater fish came from just 29 farms and numbered 1.39 million, yet they brought in $19.5 million in 2023. AquaCompat covers freshwater species only, so this group appears for completeness. US imports of marine fish, corals and seahorses are covered in the US coral and marine fish import figures.
| Census year | Type | Florida farms | US farms | Florida fish sold (thousands) | Florida sales ($1,000) | US sales ($1,000) |
|---|---|---|---|---|---|---|
| 2023 | All ornamental fish | 161 | 315 | – | 57,791 | 77,095 |
| 2023 | Freshwater egg layers | 94 | 101 | 70,357 | 27,014 | 27,090 |
| 2023 | Freshwater livebearers | 61 | 84 | 22,783 | 6,910 | 7,287 |
| 2023 | Goldfish | 12 | 66 | 176 | 437 | – |
| 2023 | Koi | 29 | 138 | 350 | 1,612 | 12,277 |
| 2023 | Saltwater ornamental fish | 20 | 29 | 967 | 16,213 | 19,520 |
| 2023 | Other ornamental fish | 25 | 40 | – | 5,605 | – |
| 2018 | All ornamental fish | 109 | 263 | – | 28,721 | 43,534 |
| 2018 | Freshwater egg layers | 61 | 77 | 54,606 | 17,149 | 17,709 |
| 2018 | Freshwater livebearers | 24 | 43 | 13,243 | 2,150 | 2,300 |
| 2018 | Goldfish | 10 | 54 | 176 | 232 | – |
| 2018 | Koi | 30 | 149 | 304 | 793 | 8,141 |
| 2018 | Saltwater ornamental fish | 15 | 28 | 1,142 | 6,780 | 8,857 |
| 2018 | Other ornamental fish | 18 | 31 | – | 1,617 | – |
| 2013 | All ornamental fish | 127 | 285 | – | 27,128 | 41,485 |
| 2013 | Freshwater egg layers | 69 | 92 | 62,165 | 15,333 | 16,076 |
| 2013 | Freshwater livebearers | 56 | 80 | 73,348 | 2,581 | 2,927 |
| 2013 | Goldfish | 3 | 42 | – | – | 4,136 |
| 2013 | Koi | 25 | 149 | 346 | 904 | 6,898 |
| 2013 | Saltwater ornamental fish | 10 | 16 | – | – | 10,323 |
| 2013 | Other ornamental fish | 18 | 28 | – | – | 1,124 |
Has US ornamental fish farming grown since 2013?
Yes in sales value: US ornamental fish sales rose from $41.5 million in 2013 to $77.1 million in 2023, and most of the rise came after 2018, according to the USDA Census of Aquaculture. These are current (nominal) dollars. They are not adjusted for inflation, so part of the increase reflects general price rises rather than more fish or more farms.
Measured by fish rather than dollars, growth is less clear. Egg-layer volume was roughly level across the three censuses, livebearer volume fell sharply between 2013 and 2018 before recovering partly in 2023, and the national goldfish count is withheld for 2018 and 2023.
What is the average farm price of an ornamental fish?
The average farm-gate price of a US-farmed freshwater egg layer was $0.38 per fish in 2023, and livebearers averaged $0.31 per fish, according to USDA Census of Aquaculture Tables 5 and 17. Koi averaged $8.55 per fish and saltwater ornamental fish $14.09 per fish. USDA calculates the average by dividing sales value by the number of fish sold, so it mixes cheap and expensive varieties within each group.
Farm-gate means what the farm received, usually from a wholesaler, not the shop price. Even so, the average rose for every group with published figures between 2018 and 2023, in current dollars.
What does farm-raised versus wild-caught mean for your tank?
In several popular species, farm-raised fish cope with a wider range of tap water than wild-caught fish, but they are not identical to the wild form. Seriously Fish describes commercially farmed neon tetras as more adaptable than wild fish, yet warns that long-term commercial breeding has weakened the ornamental strain and that farmed stock quality varies. Practical Fishkeeping reports that most farmed corydoras handle hardness up to 15 dH, wider than their wild habitat. Aquarium Co-Op recommends keeping farm-raised discus warmer than the published wild ranges because farms keep them warm, which narrows their list of discus tank mates.
Some popular species are still mostly wild-caught. Seriously Fish notes that cardinal tetras in the trade have historically come from the Rio Negro and Orinoco, although captive-bred cardinals are now sold. Angelfish sit at the other end: almost all angelfish sold are mass-produced captive strains.
Farm origin does not mean disease-free, and farmed fish can escape: USGS reports guppies established at warm-water sites in 6 states, mostly from fish farm or aquarium releases. In a Brazilian survey of 333 ornamental fish from eight farms, examined on arrival at a São Paulo wholesaler between 2018 and 2019, 70.6% carried at least one parasite. New fish from any source should go through a careful acclimation routine, and the guide to ich covers one of the parasites that survey recorded.
How we built this data
All farm counts, fish numbers, sales and average prices come from the USDA National Agricultural Statistics Service (NASS) Census of Aquaculture. The 2023 and matching 2018 figures are from the 2023 census, Volume 3, Special Studies, Part 2 (AC-22-SS-2), Tables 1, 5 and 17, published in 2024. The 2013 figures are from the 2018 census (AC-17-SS-2), Table 17, published in 2019.
AquaCompat's own calculations are limited to shares and changes, such as Florida's share of national sales and the percentage change in sales between census years. Each divides two published USDA figures. We did not adjust any dollar figure for inflation, estimate withheld cells or add data from other sources.
The data have known limits.
- USDA withholds cells (marked D) where publishing them would reveal an individual farm. Here they show as a dash, and in the CSV as blank cells with a flag. They are missing, not zero, so state figures cannot be summed to the national total.
- Very small or hobby-scale breeders may be under-counted.
- USDA reports broad categories, not species, so this page cannot say how many neon tetras or bettas were farmed.
- The census covers domestic farm sales only, not imports or retail sales.
- Florida agencies and UF/IFAS publish separate industry estimates; we have not verified them and do not use them.
Our general approach is described in how AquaCompat checks its data.
How to cite this page
Use this citation, or link to the page with the figure you use.
AquaCompat, "US Ornamental Fish Farming Statistics, 2013–2023", updated 22 October 2026, https://aquacompat.com/data/us-ornamental-fish-farming/. Underlying data: USDA NASS Census of Aquaculture, 2018 and 2023.
The data, tables and charts on this page are free to reuse under a Creative Commons Attribution 4.0 (CC BY 4.0) licence, provided you credit AquaCompat with a link to this page. Please also credit USDA NASS as the original source of the census figures.
Download the data
The CSV holds every published USDA cell used on this page, by census year, state and fish type, with a flag column marking withheld sales. The charts are 1,200 by 750 pixel PNG images.
- US ornamental fish farming, 2013–2023 (CSV) CSV · 18 KB
- Farms, fish sold, sales and average price per fish by state and type; withheld cells blank and flagged.
- Chart: US ornamental fish sales, 2013–2023 PNG · 50 KB
- Total farm sales by census year, current dollars.
- Chart: ornamental fish sales by state, 2023 PNG · 56 KB
- States with published sales figures.
- Chart: ornamental fish sales by type, 2023 PNG · 45 KB
- Egg layers, saltwater, koi and livebearers.
Questions people ask
Are most aquarium fish sold in the US farmed in Florida?
Why are goldfish sales missing for 2023?
Does the census count betta fish separately?
Did US fish farms sell more fish in 2023 than in 2013?
Sources 47 documents from 20 publishers
- Animal Welfare (Cambridge University Press), Oldfield and Murphy, Case Western Reserve University (pmc.ncbi.nlm.nih.gov): “Life in a fishbowl: Space and environmental enrichment affect behaviour of Betta splendens”
- Animals (MDPI), Sirri et al., University of Bologna (pmc.ncbi.nlm.nih.gov): “Swim Bladder Disorders in Koi Carp (Cyprinus carpio)”
- Aqualog (aqualog.de): “Discus (lexicon profile)”
- Aquarium Co-Op (aquariumcoop.com): “Freshwater Angelfish Care Guide”; “What Is Neon Tetra Disease and How Can It Be Prevented?”; “Neon and Cardinal Tetras: Beginner Schooling Fish”; “Top 5 Dither Fish to Help Shy or Aggressive Fish in Freshwater Tanks”; “Care Guide for Cory Catfish”; “Discus Fish Care Guide”; “Care Guide for Cardinal Tetras”
- Brazilian Journal of Biology, Dominguez et al., University of São Paulo (scielo.br): “Parasitological diagnosis in ornamental freshwater fish from different fish farmers of five Brazilian states”
- FishBase (fishbase.se): “Pterophyllum scalare, Freshwater angelfish: species summary”; “Length-weight relationships for Pterophyllum scalare”; “Paracheirodon innesi summary (Bayesian length-weight estimate)”; “Osteogaster aenea, Bronze corydoras”; “Length-weight relationships for Osteogaster aenea”; “Symphysodon aequifasciatus summary (Bayesian length-weight estimate)”; “Paracheirodon axelrodi summary (Bayesian length-weight estimate)”
- Journal of Fish Biology, Evers, Pinnegar and Taylor (Cefas and University of East Anglia) (ueaeprints.uea.ac.uk): “Where are they all from? – sources and sustainability in the ornamental freshwater fish trade”
- Maidenhead Aquatics (fishkeeper.co.uk species data sheet) (fishkeeper.co.uk): “Angelfish data sheet”; “Neon Tetra data sheet”; “Discus data sheet”
- Molecular Biology and Evolution, Svardal et al. (pmc.ncbi.nlm.nih.gov): “Ancestral Hybridization Facilitated Species Diversification in the Lake Malawi Cichlid Fish Adaptive Radiation”
- Nature Communications, Meier et al. (pmc.ncbi.nlm.nih.gov): “Ancient hybridization fuels rapid cichlid fish adaptive radiations”
- Neotropical Ichthyology (Crampton 2008) (scielo.br): “Ecology and life history of an Amazon floodplain cichlid: the discus fish Symphysodon”
- PlanetCatfish (via Internet Archive snapshot, 2025) (web.archive.org): “Osteogaster aenea (Bronze Cory) Cat-eLog data sheet”
- PLoS ONE, Verner-Jeffreys et al. (Cefas) (journals.plos.org): “High Prevalence of Multidrug-Tolerant Bacteria and Associated Antimicrobial Resistance Genes Isolated from Ornamental Fish and Their Carriage Water”
- Practical Fishkeeping (practicalfishkeeping.co.uk): “How long will my fish live?”; “What can I keep in my hard water aquarium?”; “Cardinal tetra, Paracheirodon axelrodi”
- Practical Fishkeeping (Julian Dignall) (practicalfishkeeping.co.uk): “Focus on commonly kept Corydoras”
- Seriously Fish (seriouslyfish.com): “Pterophyllum scalare”; “Paracheirodon innesi (Neon Tetra)”; “Osteogaster aenea (Bronze Cory)”; “Symphysodon aequifasciatus”; “Paracheirodon axelrodi (Cardinal Tetra)”
- Shrimp and Snail Breeder (aquariumbreeder.com): “Cherry shrimp in a community tank: how to make it successful”
- The Raffles Bulletin of Zoology, T. R. Roberts (lkcnhm.nus.edu.sg): “The "Celestial Pearl Danio", a new genus and species of colourful minute cyprinid fish from Myanmar (Pisces: Cypriniformes)”
- U.S. Geological Survey (nas.er.usgs.gov): “Carassius auratus (Goldfish) species profile, Nonindigenous Aquatic Species Database”; “Astronotus ocellatus (Oscar) species profile, Nonindigenous Aquatic Species Database”; “Pterygoplichthys disjunctivus (Vermiculated Sailfin Catfish) species profile, Nonindigenous Aquatic Species Database”; “Pomacea diffusa (spike-topped applesnail) species profile, Nonindigenous Aquatic Species Database”; “Neocaridina davidi (cherry shrimp) species profile, Nonindigenous Aquatic Species Database”; “Poecilia reticulata (Guppy) species profile, Nonindigenous Aquatic Species Database”
- USDA National Agricultural Statistics Service (data.nass.usda.gov): “2023 Census of Aquaculture, Volume 3, Special Studies, Part 2 (AC-22-SS-2), Tables 1, 5 and 17”; “2018 Census of Aquaculture, Volume 3, Special Studies, Part 2 (AC-17-SS-2), Table 17”
All sources accessed , . Every number on this page comes from these documents.