What are the main findings?
Each point can be quoted on its own.
- 12 of 22 cities in AquaCompat's dataset of large US water systems disinfected with chloramine in 2025: Los Angeles, Houston, Philadelphia, San Diego, Dallas, Fort Worth, Austin, Indianapolis, San Francisco, Denver, Washington and Boston.
- The US Environmental Protection Agency says more than one in five Americans use drinking water treated with chloramines (EPA web page updated March 2026).
- In EPA's UCMR 3 monitoring, 2013–2015, 54.5 percent of sampling locations in large surface-water systems serving more than 100,000 people reported chloramine use at some point, against no more than 17.2% of ground-water sampling points in any size class.
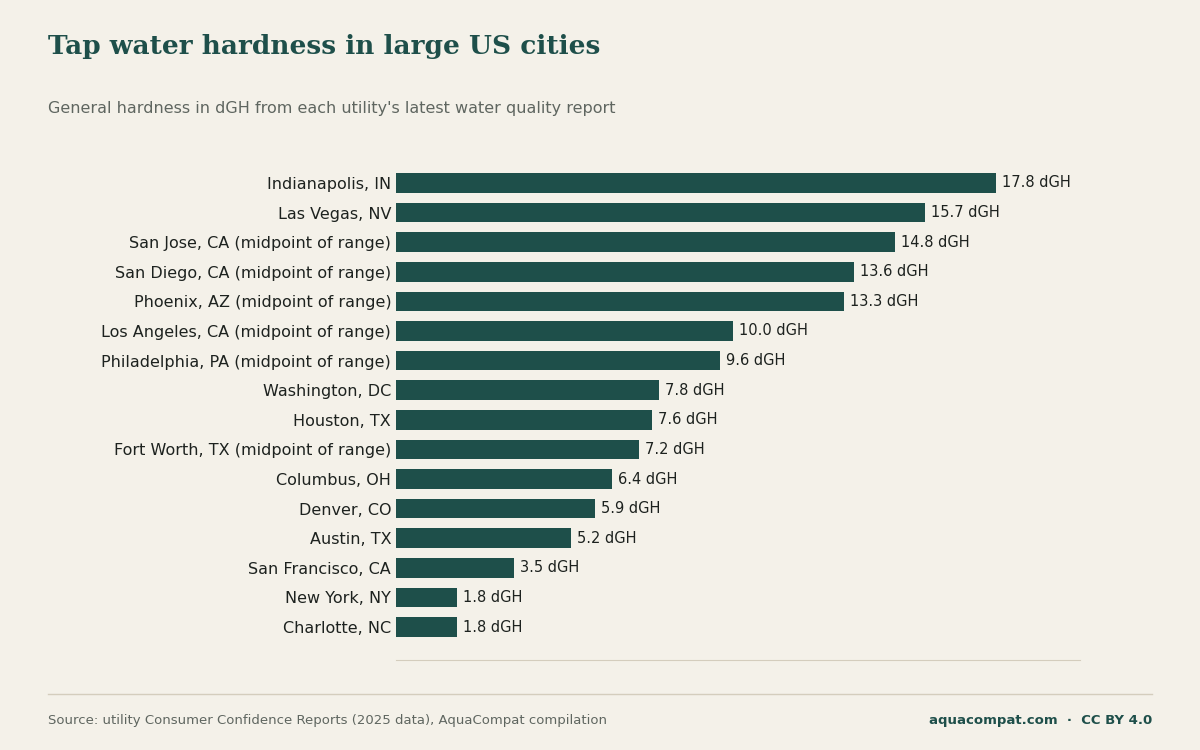
- New York and Charlotte had the softest city tap water in the dataset in 2025, averaging 32 mg/L as CaCO3, or about 1.8 dGH.
- Indianapolis had the hardest tap water among cities that print an average, 317 mg/L as CaCO3, or about 17.8 dGH, in 2025.
- By US Geological Survey hardness classes, the 2025 figures give 2 soft, 4 moderately hard, 5 hard and 5 very hard cities (of 16 with a hardness figure).
- 6 of 22 cities printed no hardness figure in their 2025 report, and only 11 of 22 cities printed a pH value or range.
Does my city use chlorine or chloramine?
Check the table: in 2025, 12 of 22 cities in this dataset named chloramine as the disinfectant in their pipes, and 9 of 22 cities named chlorine. San Jose Water says chloramine and chlorine may both be present, depending on the source reaching a neighbourhood. Chloramine is chlorine combined with ammonia, and EPA explains that utilities use it because it lasts longer in the pipes.
Three entries need a footnote. Houston's figures are for its Main System; smaller Houston systems list chlorine. DC Water switches to chlorine alone for a short period each spring. Dallas's report lists only total chlorine, so its chloramine entry comes from the utility's web page, as Denver's comes from the Denver Water FAQ.
| City | State | Disinfectant | Utility | Data year |
|---|---|---|---|---|
| New York | NY | free chlorine | NYC Department of Environmental Protection | 2025 |
| Los Angeles | CA | chloramine | Los Angeles Department of Water and Power | 2025 |
| Chicago | IL | chlorine (form not stated) | City of Chicago Department of Water Management | 2025 |
| Houston | TX | chloramine | Houston Public Works, Houston Water (Main System) | 2025 |
| Phoenix | AZ | chlorine (form not stated) | City of Phoenix Water Services Department | 2025 |
| Philadelphia | PA | chloramine | Philadelphia Water Department | 2025 |
| San Antonio | TX | free chlorine | San Antonio Water System (SAWS) | 2025 |
| San Diego | CA | chloramine | City of San Diego Public Utilities Department | 2025 |
| Dallas | TX | chloramine | Dallas Water Utilities | 2025 |
| Fort Worth | TX | chloramine | Fort Worth Water | 2025 |
| San Jose | CA | mixed: chloramine and chlorine may be present | San Jose Water | 2025 |
| Austin | TX | chloramine | Austin Water | 2025 |
| Charlotte | NC | chlorine (form not stated) | Charlotte Water | 2025 |
| Columbus | OH | chlorine (form not stated) | City of Columbus Division of Water | 2025 |
| Indianapolis | IN | chloramine | Citizens Energy Group (Citizens Water) | 2025 |
| San Francisco | CA | chloramine | San Francisco Public Utilities Commission | 2025 |
| Seattle | WA | chlorine (form not stated) | Seattle Public Utilities | 2025 |
| Denver | CO | chloramine | Denver Water | 2025 |
| Washington | DC | chloramine | DC Water (treated by Washington Aqueduct) | 2025 |
| El Paso | TX | chlorine (form not stated) | El Paso Water | 2025 |
| Las Vegas | NV | free chlorine | Las Vegas Valley Water District | 2025 |
| Boston | MA | chloramine | Massachusetts Water Resources Authority / Boston Water and Sewer Commission | 2025 |
Why does chlorine versus chloramine matter for an aquarium?
It decides which treatment works. UF/IFAS Extension describes free chlorine as something vigorous aeration can drive off in about 24 hours, while chloramine survives aeration and has to be neutralised chemically. Breaking chloramine apart also frees ammonia, so the conditioners that bind ammonia as well as chlorine suit anyone in the chloramine column above.
A common misreading is that leaving a bucket to stand overnight makes any city's tap water safe. That works only where the report names chlorine, and even there the label can change: San Jose's supply is mixed and DC Water switches disinfectant each spring. Our step-by-step tap water treatment guide sets out the order of treating and testing.
How hard is tap water in big US cities?
Most big-city tap water is moderately hard to very hard: averages or range midpoints in the 2025 reports run from about 1.8 dGH in New York and Charlotte to about 17.8 dGH in Indianapolis. The chart converts each utility's figure to German degrees of general hardness (dGH), the unit aquarium test kits and species guides use.
Utilities report hardness in mg/L (or ppm) as calcium carbonate. The conversion factor is 17.848 mg/L as CaCO3 per dGH, so divide the report's mg/L figure by that factor; grains per gallon convert at 17.1 mg/L as CaCO3 per 1 grain per gallon. Total hardness in a utility report measures calcium and magnesium, which is what an aquarium GH test reads; the explainer on GH and KH covers how it differs from carbonate hardness (KH).
Why do some cities show a range instead of one hardness figure?
Because cities that blend several sources deliver different water to different neighbourhoods, and their reports print per-source or per-plant figures rather than one average. Los Angeles is the clearest case: Los Angeles Aqueduct water and local wells average roughly half the hardness of the water from the Metropolitan Water District's Weymouth and Diemer plants. Philadelphia's three plants, San Diego's plants and purchased water, and San Jose's mountain, valley and well sources work the same way. For those cities the chart's midpoint is only a rough centre, and the range shown in the next table is the figure to plan around. Supply can also change with the season: Las Vegas says some areas receive groundwater blended with Lake Mead water between April and October.
Which US cities have soft water and which have hard water?
Only New York and Charlotte have soft water by the USGS definition, while Phoenix, San Diego, San Jose, Las Vegas and Indianapolis have very hard water. USGS hardness classes are 0–60 soft, 61–120 moderately hard, 121–180 hard, over 180 very hard mg/L as CaCO3. Applied to the 2025 reports, that gives 2 soft, 4 moderately hard, 5 hard and 5 very hard cities (of 16 with a hardness figure). The second table converts the class boundaries to dGH.
| City | State | Hardness (mg/L as CaCO3) | Hardness (dGH) | Basis | USGS class |
|---|---|---|---|---|---|
| New York | NY | 32 | 1.8 | average printed in report | soft |
| Charlotte | NC | 32 | 1.8 | average printed in report | soft |
| San Francisco | CA | 62 | 3.5 | average printed in report | moderately hard |
| Austin | TX | 93 | 5.2 | average printed in report | moderately hard |
| Denver | CO | 105 | 5.9 | average printed in report | moderately hard |
| Columbus | OH | 115 | 6.4 | average printed in report | moderately hard |
| Fort Worth | TX | 129 | 7.2 | midpoint of range 108-150 | hard |
| Houston | TX | 135.5 | 7.6 | average printed in report | hard |
| Washington | DC | 139 | 7.8 | average printed in report | hard |
| Philadelphia | PA | 171 | 9.6 | midpoint of range 72-270 | hard |
| Los Angeles | CA | 179 | 10.0 | midpoint of range 78-280 | hard |
| Phoenix | AZ | 237 | 13.3 | midpoint of range 172-302 | very hard |
| San Diego | CA | 242.5 | 13.6 | midpoint of range 200-285 | very hard |
| San Jose | CA | 264 | 14.8 | midpoint of range 77-451 | very hard |
| Las Vegas | NV | 280 | 15.7 | single figure printed for softener settings | very hard |
| Indianapolis | IN | 317 | 17.8 | average printed in report | very hard |
| class | mg_l_caco3 | dgh |
|---|---|---|
| soft | 0-60 | 0-3.4 |
| moderately hard | 61-120 | 3.4-6.7 |
| hard | 121-180 | 6.8-10.1 |
| very hard | more than 180 | more than 10.1 |
Is "hard water" in a utility report the same as hard water for fish?
Not quite. The USGS scale calls anything above 120 mg/L as CaCO3 hard, which is under 7 dGH, while the German classification that many aquarium books follow uses these bands: <8.4 soft; 8.4–14 medium; >14 hard dGH (German WRMG 2007). Houston and Washington, both "hard" to the USGS, count as soft in German terms. Compare a species' dGH range with your city's dGH, not with the word in the utility report. Private wells are outside this dataset, and USGS found 60 percent of sampled domestic wells had hard water, so well owners should test.
What pH is tap water in large US cities?
Where it is reported, big-city tap water is close to neutral or alkaline, and San Francisco's is the most alkaline, averaging pH 9.3 in 2025. Only 11 of 22 cities printed pH at all, so the table below is short.
| City | State | pH average | pH range | Report pages |
|---|---|---|---|---|
| San Francisco | CA | 9.3 | 9-9.7 | p.3 chloramination; p.11 table |
| Charlotte | NC | 8.5 | 7.4-9.5 | p.3 chlorine; p.6 residual; p.8 hardness and pH |
| Houston | TX | 7.8 | 7.3-8.3 | PDF p.8 chloramines; PDF p.9 secondary standards |
| Columbus | OH | 7.8 | 7.8-7.9 | p.4 treatment; p.5 per-plant values; p.6 system averages |
| Indianapolis | IN | 7.7 | 6.9-8.5 | p.3 treatment; p.5 secondary table; p.7 chloramines; p.12 hardness text |
| New York | NY | 7.3 | 6.9-8.1 | PDF p.5 treatment; PDF p.13 results table |
| Los Angeles | CA | – | 7-8.7 | PDF p.9 chloramines; PDF p.25 Table III |
| Phoenix | AZ | – | 6.6-8.8 | PDF p.3 disinfection; PDF p.4 aesthetic table |
| Philadelphia | PA | – | 7.03-7.34 | Treatment section; Secondary Chemicals table; Sodium, Hardness and Alkalinity table |
| San Diego | CA | – | 7.56-8.64 | p.4 chloramine; p.9 residual; p.10 other parameters |
| Fort Worth | TX | – | 7.8-8.5 | p.5 monochloramine; p.8 residual; p.9 secondary constituents |
What does high tap water pH mean when the water is also chloraminated?
It makes the ammonia released from chloramine more dangerous. UF/IFAS Extension tables show that higher pH shifts total ammonia toward its toxic un-ionised form, with roughly ten times more of it at pH 8 than at pH 7 in warm water. San Francisco pairs chloramine with an average pH of 9.3, so an ammonia-binding conditioner matters more there than in soft, chlorinated New York. The aquarium pH guide explains how KH holds pH steady once the water is in the tank.
Which fish suit the tap water in your city?
Most popular community fish cope with the moderately hard water most large cities supply, but the softest and hardest cities rule some species out without water treatment. The table compares each species' published general hardness range, from the AquaCompat species fact base (Seriously Fish, Maidenhead Aquatics and other care sources), with each city's 2025 dGH figure. A city in the "above" column supplies water harder than the published range; "below" means softer.
| Species | Published GH range | Cities inside the range | Cities above it (harder) | Cities below it (softer) |
|---|---|---|---|---|
| Neon Tetra | 1–12 dGH | New York, Charlotte, San Francisco, Austin, Denver, Columbus, Fort Worth*, Houston, Washington, Philadelphia*, Los Angeles* | Phoenix*, San Diego*, San Jose*, Las Vegas, Indianapolis | none |
| Discus | 0–8 dGH | New York, Charlotte, San Francisco, Austin, Denver, Columbus, Fort Worth*, Houston, Washington | Philadelphia*, Los Angeles*, Phoenix*, San Diego*, San Jose*, Las Vegas, Indianapolis | none |
| Crystal Red Shrimp | 4–6 dGH | Austin, Denver | Columbus and every harder city | New York, Charlotte, San Francisco |
| Cherry Shrimp | 6–10 dGH | Columbus, Fort Worth*, Houston, Washington, Philadelphia*, Los Angeles* | Phoenix*, San Diego*, San Jose*, Las Vegas, Indianapolis | New York, Charlotte, San Francisco, Austin, Denver |
| Guppy | 8–30 dGH | Philadelphia*, Los Angeles*, Phoenix*, San Diego*, San Jose*, Las Vegas, Indianapolis | none | Washington and every softer city |
| Molly | 15–25 dGH | Las Vegas, Indianapolis | none | San Jose* and every softer city |
| Peacock Cichlid | 10–25 dGH | Los Angeles*, Phoenix*, San Diego*, San Jose*, Las Vegas, Indianapolis | none | Philadelphia* and every softer city |
How should fishkeepers use the species comparison?
Soft-water cities
New York and Charlotte, at about 1.8 dGH, suit soft-water tetras and rasboras straight from the tap: neon tetras (1–12 dGH), harlequin rasboras (1–12 dGH) and discus (0–8 dGH) all fit. The harlequin, chili and galaxy rasbora comparison sets out what the small rasboras tolerate. The same water is too soft for hard-water livebearers, and the fish that live well with guppies share that need for minerals.
Very hard cities
Indianapolis and Las Vegas averages fall inside the published ranges for mollies (15–25 dGH) and Lake Malawi cichlids such as the peacock (10–25 dGH) and yellow lab (10–25 dGH), which also want alkaline water (pH 7.5–8.5 for the peacock). Our tank mates for Malawi cichlids build on that base. Keeping discus there means softening the water first; the guide to RO and RO/DI water explains mixing reverse osmosis water with tap water to a target GH, and the companions that suit discus need the same soft water.
Shrimp
Crystal red shrimp (4–6 dGH) match only the Austin and Denver averages, while cherry shrimp (6–10 dGH) match the middle of the table from Columbus to Los Angeles. The Caridina versus Neocaridina shrimp breakdown explains the split, and tank mates for cherry shrimp follow the same moderate water.
A Philadelphia, Los Angeles or San Jose midpoint can sit inside a species range while a given address is well outside it, so test GH before buying fish, then check the community in the tank mate guides by species.
How many Americans get chloraminated tap water?
EPA puts the figure at more than one in five Americans: its chloramines page, updated March 2026, says that share of the population uses drinking water treated with chloramines.
EPA's UCMR 3 monitoring, 2013–2015, shows where chloramine is concentrated. At sampling points where water has spent longest in the pipes, 54.5 percent of sampling locations in large surface-water systems serving more than 100,000 people reported chloramine use at some point, against 9.7% at small ground-water systems. Large cities drawing from rivers and reservoirs are the most likely to chloraminate, which matches the city table.
| Source water | System size (people served) | Sampling locations | Exclusive chlorine | Chloramine only or with chlorine | Any chloramine | Any chloramine (%) |
|---|---|---|---|---|---|---|
| Ground water | 10,000 or fewer | 710 | 535 | 67 | 69 | 9.7 |
| Ground water | 10,001-100,000 | 3,813 | 3,031 | 435 | 450 | 11.8 |
| Ground water | more than 100,000 | 697 | 555 | 113 | 120 | 17.2 |
| Surface water | 10,000 or fewer | 285 | 153 | 74 | 99 | 34.7 |
| Surface water | 10,001-100,000 | 2,176 | 1,163 | 604 | 750 | 34.5 |
| Surface water | more than 100,000 | 591 | 189 | 218 | 322 | 54.5 |
How we built this data
AquaCompat read the Consumer Confidence Report (CCR), the annual water quality report every US community water system sends its customers, for the main utility in 22 of the largest US cities. The editions used cover calendar year 2025. A copy of each report was saved and every figure re-checked against it on 22 October 2026; the Dallas and Denver disinfectant entries also use each utility's water quality web page. National figures come from EPA's chloramines page and EPA-810-R-16-012, and hardness classes from USGS Water-Supply Paper 2254 (Hem, 1985). We did no water testing of our own.
Our calculations are simple.
- dGH is mg/L as CaCO3 divided by 17.848; Denver's figures, printed in parts per billion, were first divided by 1,000.
- Where a report printed only a range or per-source figures, the hardness table and chart use the simple midpoint of the lowest and highest values, labelled every time. It is not a measured average.
- Las Vegas prints one hardness figure for setting water softeners, used as printed.
- The species table compares each city's dGH with the GH ranges in AquaCompat's species fact files on 22 October 2026.
The data have limits.
- CCR averages vary by source, season and neighbourhood. Check your own utility's report, or test your tap.
- 6 of 22 cities print no hardness, and only 11 of 22 cities print pH; missing cells are left blank.
- Jacksonville and Nashville are missing because no report was collected. Oklahoma City was dropped because its report could not be stored for re-checking.
- Each city entry covers one utility; suburbs often buy water from a different system.
- UCMR 3 counts sampling locations from 2013–2015, not people, and some systems have changed disinfectant since.
How to cite this page
Use this citation, or link to this page next to the figure you use.
AquaCompat, "Tap Water Hardness, pH and Chloramine in Large US Cities: Data for Fishkeepers", updated 22 October 2026, https://aquacompat.com/data/tap-water-for-aquariums/.
The data, tables and charts on this page are free to reuse under a Creative Commons Attribution 4.0 (CC BY 4.0) licence, provided you credit AquaCompat with a link to this page. For a single city's figure, please also name that utility's water quality report.
Download the data
The city CSV holds one row per city with the utility, disinfectant, hardness in mg/L and dGH, pH, report title and report URL. The chart is a 1,200 by 750 pixel PNG.
- US city tap water for aquariums, 2025 reports (CSV) CSV · 7 KB
- 22 cities: disinfectant, hardness average and range in mg/L and dGH, pH, data year, source report and notes.
- Chloramine use by source water and system size, UCMR 3 (CSV) CSV · 1 KB
- EPA sampling-location counts and shares, 2013–2015.
- Chart: tap water hardness by city in dGH PNG · 92 KB
- 16 large US cities, 2025 data, range midpoints labelled.
Questions people ask
Where do I find my own city's tap water hardness?
Search for your water utility's Consumer Confidence Report, often called an annual water quality report. Hardness, when printed, usually sits in a secondary or "other parameters" table in mg/L or ppm as CaCO3, sometimes with grains per gallon. The conversion factor to dGH is 17.848 mg/L as CaCO3 per dGH. If the report gives several sources, ask the utility which one serves your street.
If chloramine is safe to drink at my city's level, why does it harm fish?
A fish's gill blood is separated from the water by only one or two cells, as the Southern Regional Aquaculture Center notes, so far smaller doses reach it. US rules allow up to 4 mg/L of chloramine, measured as chlorine, in drinking water, while the Merck Veterinary Manual reports adverse effects in fish from 0.02 mg/L chlorine and deaths at about 0.04 mg/L chlorine. Every city in this dataset keeps a disinfectant residual in its pipes, so every tap needs treating before it reaches a tank.
Can I use these city averages instead of testing my water?
Use them to plan, not to replace a test. A city average hides differences between sources and seasons; Philadelphia's three plants, for example, average 101–169 mg/L as CaCO3. A GH and KH test on water from your own tap gives the number that matters for your fish.
Sources 64 documents from 39 publishers
- Aquarium Co-Op (aquariumcoop.com): “Does dechlorinator remove ammonia?”; “Care Guide for Cherry Shrimp”; “Care Guide for Harlequin Rasboras and Lambchop Rasboras”
- Austin Water (austin.widen.net): “Annual Water Quality Report 2025”
- Charlotte Water (charlottenc.gov): “2025 Annual Drinking Water Quality Report”
- Citizens Energy Group (Citizens Water) (info.citizensenergygroup.com): “2025 Drinking Water Report”
- City of Chicago Department of Water Management (chicago.gov): “Chicago Water Quality Report 2025”
- City of Columbus Division of Water (columbus.gov): “2025 Drinking Water Consumer Confidence Report”
- City of Phoenix Water Services Department (phoenix.gov): “2025 Water Quality Report”
- City of San Diego Public Utilities Department (sandiego.gov): “2025 Annual Drinking Water Quality Report”
- Dallas Water Utilities (dallascityhall.com): “City of Dallas Water Quality Report 2025”; “Dallas Water Utilities, Water Quality Information”
- DC Water (treated by Washington Aqueduct) (dcwater.com): “2026 Drinking Water Quality Report: Summarizing 2025 Water Quality Test Results”
- Denver Water (denverwater.org): “2026 Water Quality Report”; “Denver Water, Water Quality FAQs”
- El Paso Water (epwater.org): “2025 Drinking Water Report”
- FishBase (fishbase.se): “Symphysodon aequifasciatus, Blue discus: species summary”
- Fort Worth Water (fortworthtexas.gov): “2025 Water Quality Report”
- Houston Public Works, Houston Water (Main System) (houstonpublicworks.org): “Houston Water Quality Report 2025”
- Las Vegas Valley Water District (lvvwd.com): “2026 Water Quality Report”
- Los Angeles Department of Water and Power (ladwp.com): “Drinking Water Quality Report 2025”
- Maidenhead Aquatics (fishkeeper.co.uk species data sheet) (fishkeeper.co.uk): “Neon Tetra data sheet”; “Discus data sheet”; “Molly data sheet”; “Hybrid Peacock (Aulonocara sp.) data sheet”; “Yellow Labidochromis data sheet”
- Massachusetts Water Resources Authority / Boston Water and Sewer Commission (bwsc.org): “MWRA 2025 Drinking Water Test Results, Boston edition”
- Merck Veterinary Manual (merckvetmanual.com): “Environmental Diseases of Aquatic Animals in Aquatic Systems, Francis-Floyd, Yanong and Petty”; “Management of Aquarium Fish, Petty, Francis-Floyd and Yanong”; “Disorders and Diseases of Fish (pet owner version)”
- NYC Department of Environmental Protection (nyc.gov): “New York City 2025 Drinking Water Supply and Quality Report”
- Philadelphia Water Department (water.phila.gov): “Drinking Water Quality Report 2025 (web report, published 2026)”
- Practical Fishkeeping (practicalfishkeeping.co.uk): “Problem solver: New Tank Syndrome”; “How to Cycle a Fish Tank: The Complete Guide”
- San Antonio Water System (SAWS) (saws.org): “2026 Water Quality Report, San Antonio Water System”
- San Francisco Public Utilities Commission (sfpuc.gov): “2025 Annual Water Quality Report, City of San Francisco”
- San Jose Water (sjwater.com): “2025 Annual Water Quality Report (Consumer Confidence Report)”
- Seachem Laboratories (manufacturer) (seachem.com): “Prime”
- Seattle Public Utilities (seattle.gov): “2025 Drinking Water Quality Report”
- Seriously Fish (seriouslyfish.com): “Paracheirodon innesi (Neon Tetra)”; “Poecilia reticulata”; “Poecilia sphenops”; “Aulonocara stuartgranti”; “Aulonocara baenschi”; “Trigonostigma heteromorpha (Harlequin)”; “Labidochromis caeruleus”
- Shrimp and Snail Breeder (aquariumbreeder.com): “Crystal Red Shrimp: detailed guide, care, diet and breeding”; “Red Cherry Shrimp: detailed guide, care, diet and breeding”
- Shrimp Science (shrimpscience.com): “Crystal Red Shrimp - Care Guide”; “Red Cherry Shrimp - Care Guide”
- Southern Regional Aquaculture Center (srac.msstate.edu): “Interpretation of Water Analysis Reports for Fish Culture, SRAC Publication No. 4606”; “Interactions of pH, Carbon Dioxide, Alkalinity and Hardness in Fish Ponds, SRAC Publication No. 464, Wurts and Durborow”; “How to Start a Biofilter, SRAC Publication No. 4502, DeLong and Losordo”
- University of Florida IFAS Extension (EDIS) (ask.ifas.ufl.edu): “Teach Aquaculture Curriculum: Chlorine, Friend or Foe? (FA171), Chapman et al.”; “Ammonia in Aquatic Systems (FA16/FA031), Francis-Floyd, Watson, Petty and Pouder”
- US Code of Federal Regulations (eCFR) (ecfr.gov): “40 CFR 141.65 Maximum residual disinfectant levels”
- US Environmental Protection Agency (epa.gov): “Chloramines in Drinking Water (page last updated March 12, 2026)”
- US Environmental Protection Agency, Office of Water (epa.gov): “Six-Year Review 3 Technical Support Document for Disinfectants/Disinfection Byproducts Rules (EPA-810-R-16-012)”
- US Environmental Protection Agency, WaterSense (epa.gov): “Point-of-Use Reverse Osmosis Systems”; “Water Efficient Point-of-Use Reverse Osmosis Systems (fact sheet EPA-832-F-22-021)”
- US Geological Survey (pubs.usgs.gov): “Study and Interpretation of the Chemical Characteristics of Natural Water, Water-Supply Paper 2254 (Hem, 3rd ed.)”; “The Quality of Our Nation's Waters: Quality of Water from Domestic Wells in Principal Aquifers of the United States, 1991-2004, Overview of Major Findings (Circular 1332)”
- Wikipedia (en.wikipedia.org): “dGH”; “Carbonate hardness”
All sources accessed , . Every number on this page comes from these documents.